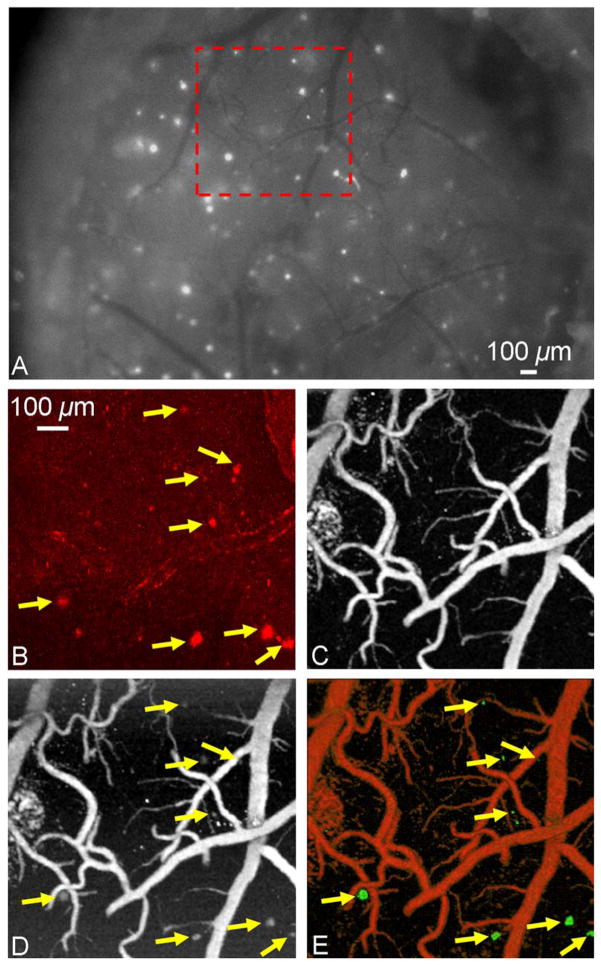
Figure 3.
(Color online) In vivo brain imaging of a Congo-red-injected 10-month-old APP/PS1 mouse through a cranial window. (A) The exposed cortical brain region imaged using conventional fluorescence microscopy through the cranial window. The region of interest marked by a red dashed box was imaged by (B) multiphoton microscopy, and optical-resolution photoacoustic microscopy at (C) 570 nm and (D) 523 nm, respectively. (E) The processed dual-contrast optical-resolution photoacoustic microscopic image, where amyloid plaques are colored green and blood vessels are colored red (volumetric visualization is available online as Media 1). Arrows: plaques. Scale bar in (B) applies for (B–E).

