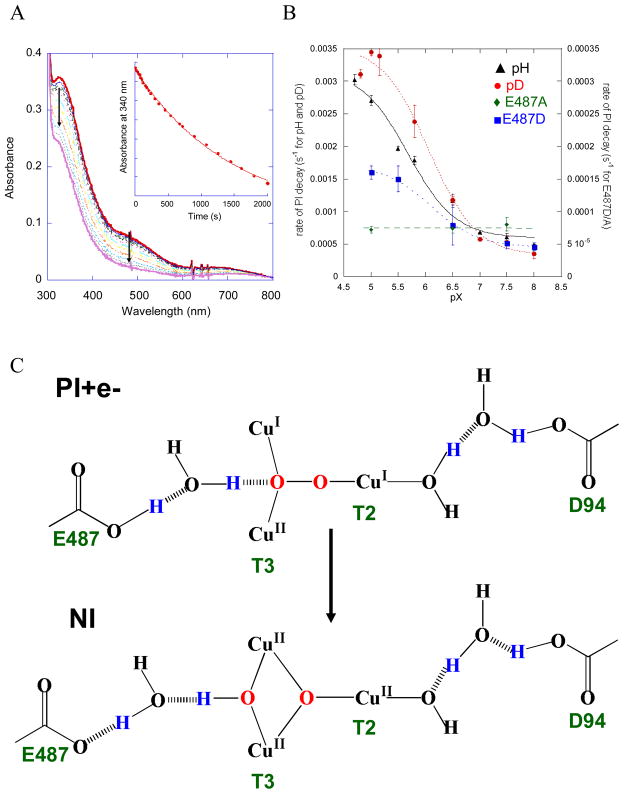
Figure 24.
Absorption spectra showing the decay of PI to NI. Inset shows the loss of the 340 nm transition as a function of time (A), rate of decay of PI as a function of pH and pD and as a function of pH in the E487D and E487A mutants (B), and schematic showing the movement of protons (in blue) upon cleavage of the O-O bond, i.e. conversion of PI+e− to NI (C).39

