
Figure 2.
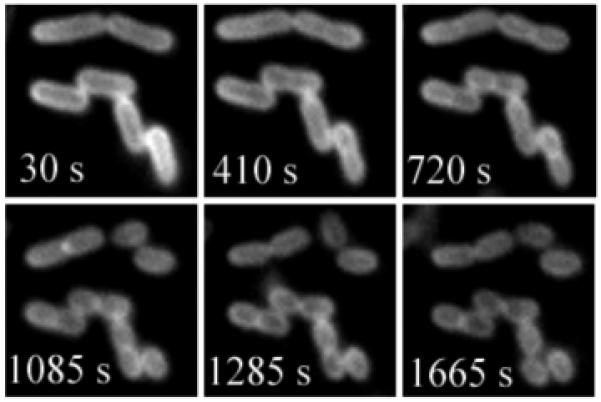
Montage from a larger movie showing binary fission of E. coli cells stained with 3. The cells were imaged, using fluorescence microscopy, every 5 seconds for 30 minutes. The times stated in each panel correspond to the movie time point and the scale bar represents 2 μM.