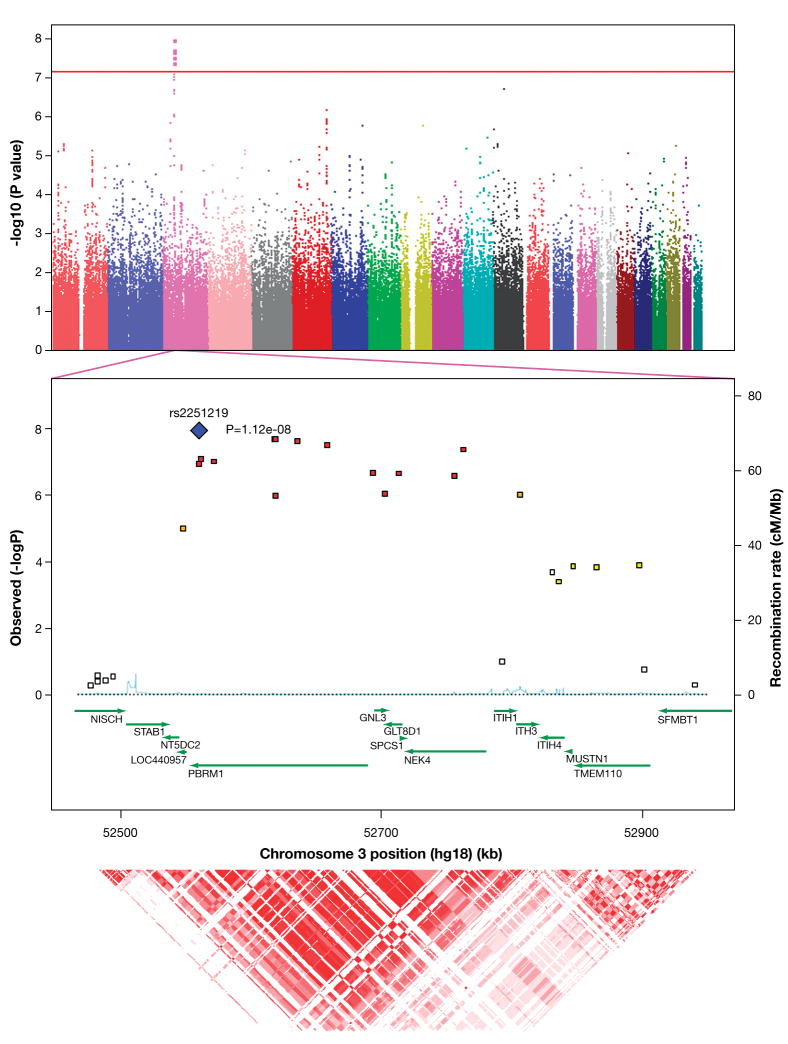
Figure 1.
a. Manhattan plot of the meta-analysis results, generated by Haploview 4.0. Physical position is shown along the x-axis, -log (meta-p-value) is shown along the y-axis, and each chromosome is shown in a distinct color. The red guideline indicates the threshold of genome-wide significance (7.2 ×10⁻⁸). b. Detail of the associated region, generated by SNAP 2.0. Physical position and gene annotations (HapMap release 22) are shown along the x-axis, -log (meta-p-value) is shown on the left y-axis, recombination rate (CEU) on the right y-axis. c. Linkage disequilibrium (r2) as estimated from HapMap 3 phased genotypes, generated by UCSC Genome Browser. Darker red indicates higher values.

