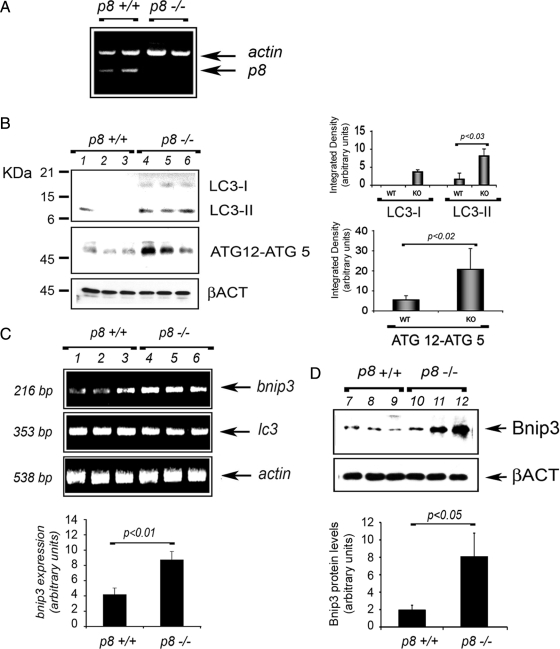
Figure 7.
Cardiac tissue from p8 −/− mice exhibits higher basal autophagy and present increased levels of both Bnip3 RNA and protein. (A) p8 is expressed in the heart. RT-PCR analysis of total RNA from LVs of wilt type (p8 +/+) and knockout mice (p8 −/−). p8 and actin were coamplified, and PCR products were separated on 1.8% agarose gel. (B) p8 −/− mice have higher LC3-II and ATG12–5 levels. Western blot analysis of LV extracts from p8 +/+ and p8 −/− mice by using anti-LC3B, anti-ATG12-5, and β-actin antibodies. The quantifications are shown in the histograms. The values represent the mean ± SEM. Samples were subjected to unpaired Student's t test (p < 0.03 and p < 0.02, respectively; n = 5). (C) p8 −/− mice have higher bnip3 expression. bnip3, lc3, and actin were amplified from LV RNA of p8 +/+ and p8 −/− mice. PCR products were quantified and subjected to unpaired Student's t test (p < 0.01; n = 6). (D) p8 −/−mice have higher Bnip3 protein levels. Western blot analysis of LV extracts from p8 +/+ and p8 −/− mice by using anti Bnip3 and β-actin antibodies, as indicated. The quantifications are shown in the histograms (p < 0.05; n = 4). The values represent the means ± SEM.

