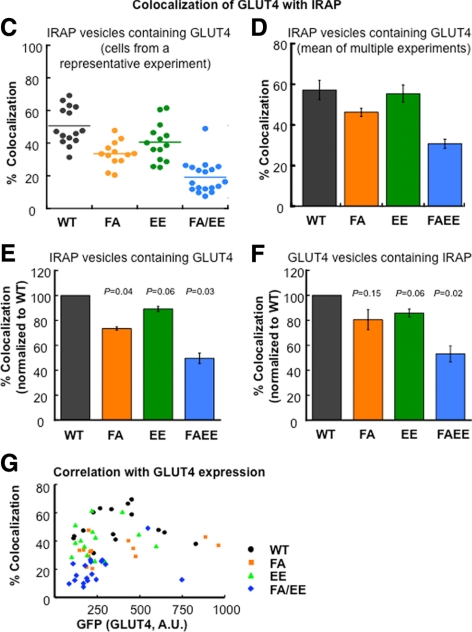
Figure 2.
Colocalization of the GLUT4 and IRAP in the evanescent field. (A) TIRF images illustrating the distribution of HA-GLUT4-GFP and endogenous IRAP in basal adipocytes. WT, wild-type HA-GLUT4-GFP; FA, F5A mutation; EE, EE499,501AA mutation; FA/EE, F5A/EE499,501AA mutation in HA-GLUT4-GFP. Images are identically scaled and corrected for local background. Cell boundaries are noted by dashed lines. Scale bar, 10 μm. (B) Quantification of GLUT4 colocalization with IRAP in the basal adipocytes. Data are from cells in A. The scatter plots illustrate the intensity distributions, normalized to EPI fluorescence to correct for cell-to-cell variations in expression of the HA-GLUT4-GFP constructs and endogenous IRAP, of ROI picked from the Cy3 channel (IRAP-positive, red circles) or GFP channel (GLUT4-positive, green circles) versus their intensities in the other channel. For data analysis the thresholds used in absolute intensity were the same for each cell type; however, for graphing the data the low-threshold intensity lines shown were scaled to the total expression of the HA-GLUT4-GFP or IRAP of the cells shown. Circles in the quadrant to the right of the green line and above the red line are scored as positive for both probes. The percent of ROI (circles) chosen in the red channel that are positive in the green [GLUT4/IRAP(+)] and vice versa [IRAP/GLUT4(+)] for the data shown in these scatter plots are noted above the plots. (Also see Supplemental Figure 1 for further details on the method). (C) Colocalization of GLUT4 and IRAP from an individual experiment. The percent colocalization is the percent of IRAP vesicles (ROI identified in red channel) whose intensity in the green channel is above the green channel low-intensity threshold. Each symbol is the colocalization determined in an individual cell within the experiment. The lines are the average values. All the data from each individual experiment were collected during one block of time on the microscopy; all the green channel images were processed with the same green channel low-intensity threshold, and all the red images were processed with the same red channel low-intensity threshold. Nine to 19 cells for each construct were analyzed in each individual experiment. (D) The average colocalization (percent of IRAP vesicles positive for GLUT4) measured in three to four independent experiments ± SEM. The data illustrate the reproducibility of the measurements across independent experiments. (E and F) Colocalization of GLUT4 mutants with IRAP normalized to WT GLUT4 colocalization with IRAP. The colocalizations of the different mutants with IRAP determined in individual experiments were normalized to the colocalization of WT GLUT4 measured in the same experiment, illustrating how the mutations affect the WT GLUT4 colocalization. In E the percent of IRAP vesicles (ROI identified in the red channel) that are also positive for GLUT4 are plotted. In F the percent of GLUT4 vesicles (ROI identified in the green channel) that are also positive for IRAP are plotted. The data are averages ± SEM of three to four independent experiments. The p values for paired t test are shown and are the comparison to WT GLUT4. (G) Correlation between the HA-GLUT4-GFP expression of the various constructs and the colocalization of GLUT4 with IRAP. The colocalization of GLUT4 with IRAP in 12–16 cells is plotted as a function of the HA-GLUT4-GFP expression level per cell for each GLUT4 mutant.


