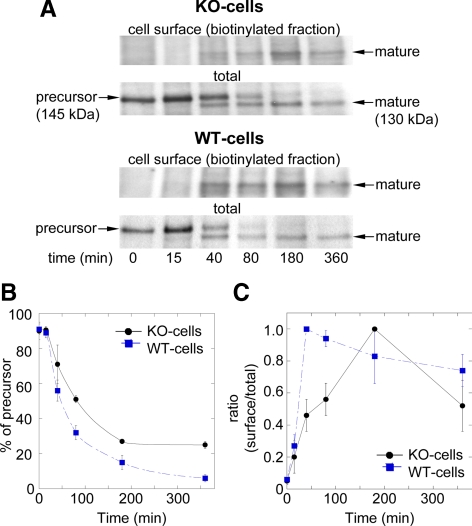
Figure 4.
Processing and surface expression of N-cadherin is impaired in KO-cells. (A) KO- and WT-cells were labeled with [35S]methionine and then chased for the indicated times (minutes). At the end of each period, cells were surface biotinylated, lysed, and immunoprecipitated with anti-N-cadherin. Samples were divided in halves with one representing the sum of intracellular and surface pools of N-cadherin (total); the other half was incubated with streptavidin-agarose to isolate biotinylated N-cadherin (surface). All samples were fractionated by SDS-PAGE followed by fluorography. Bands in the films were scanned and processed with ImageJ. (B) The integrated intensity of the signal associated with the band of the precursor (145 kDa) at each time point is expressed as percentage of the total N-cadherin signal (precursor + mature). (C) The integrated intensity of the signal corresponding to mature N-cadherin (130 kDa band) present at the biotinylated fraction (cell surface) is expressed as fraction of the total mature N-cadherin signal (biotinylated + nonbiotinylated). Shown are mean ± SD of three to five independent experiments.

