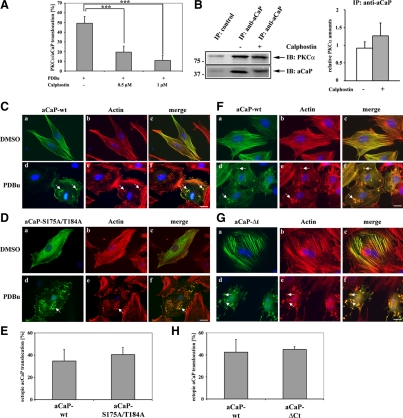
Figure 6.
The C-terminal tail of h3/acidic CaP or h3/acidic CaP phosphorylation at Ser175 and/or Thr184 is not necessary for PDBu-mediated translocation, but can be blocked by a PKC inhibitor. (A) REF52.2 cells, grown on glass coverslips, were serum starved for 30 min, pretreated with either 0.5 or 1 μM calphostin or DMSO as control for 30 min, and then stimulated with 1 μM PDBu for 30 min. Endogenous aCaP and PKCα proteins were immunofluorescently labeled with the rabbit anti-h3/acidic CaP and the mouse anti-PKCα antibody. The percentage of cells showing a translocation of h3/acidic CaP/PKCα to the cell membrane/podosome-like structures was determined and graphed. Results are from three independent experiments. Note that the difference between DMSO pretreated control cells and both 0.5 μM calphostin (p = 0.0005) and 1 μM calphostin (p = 0.0001) pretreated cells is highly statistically significant. (B) Right, REF52.2 cells were treated with either DMSO as control (lane 2) or 1 μM calphostin (lane 3) for 30 min before preparing cell lysates. Lysates were incubated with the specific h3/acidic CaP antibody (lanes 2 and 3), and the immunocomplex was precipitated using protein G-coupled Dynabeads. Lysates incubated with the GFP-antibody served as negative control (lane 1). Proteins were eluted from the beads and subsequently analyzed by Western blotting. Arrows indicate the positions of PKCα and aCaP. A typical Western blot is shown here, and the experiment was repeated three times. Left, densitometry of all three Western blots showing the amount of PKCα coprecipitated together with h3/acidic CaP in the presence of calphostin (gray column) or DMSO as control (white column). The relative protein amount of PKCα was normalized to the relative amount of precipitated h3/acidic CaP. (C) REF52.2 cells were transfected with pFLAG-aCaP-wt, grown for 24 h, and then treated with DMSO as control (a–c) or 1 μM PDBu (d–f) for 30 min. The ectopically expressed FLAG-aCaP-wt protein was detected by immunofluorescence staining using the mouse monoclonal anti-FLAG antibody. Actin filaments were visualized with Alexa568-labeled phalloidin. Bar, 20 μm. (D) REF52.2 cells were transfected with pFLAG-aCaP-S175A/T184A and treated as described under A. Bar, 20 μm. (E) pFLAG-aCaP-wt or pFLAG-aCaP-S175A/T184A transfected cells, stimulated with 1 μM PDBu, were screened for translocation of the ectopically expressed proteins to the cell cortex/podosome-like structures. The percentage of cells showing a translocation is shown in the graph. The results are from three independent experiments, in each at least 100 cells were assessed. (F) REF52.2 cells were transfected with pEGFP-aCaP-wt, grown for 24 h and then treated with DMSO as control (a–c) or 1 μM PDBu (d–f) for 30 min. Actin filaments were visualized with Alexa568-labeled phalloidin. Bar, 20 μm. (G) REF52.2 cells were transfected with pEGFP-aCaP-ΔCt and treated as described under F. Bar, 20 μm. (H) pEGFP-aCaP-wt– or pEGFP-aCaP-ΔCt–transfected cells, stimulated with 1 μM PDBu, were screened for translocation of the ectopically expressed proteins to the cell cortex/podosome-like structures. The percentage of cells showing a translocation is shown in the graph. The results are from three independent experiments, in each at least 100 cells were assessed.

