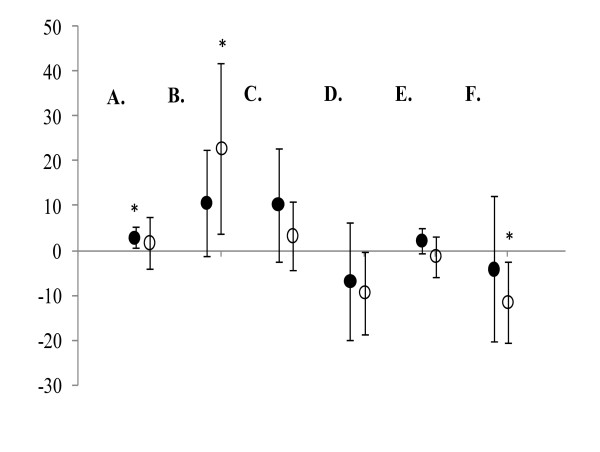
Figure 2.
Mean percent change scores ± 95% confidence intervals for (A) critical velocity, (B) anaerobic running capacity, (C) aerobic capacity, (D) percent body fat, (E) lean body mass, and (F) fat mass. Black circles = GT group; White circles = PL group. * indicates a significant difference when 0 is outside of the 95% confidence interval.

