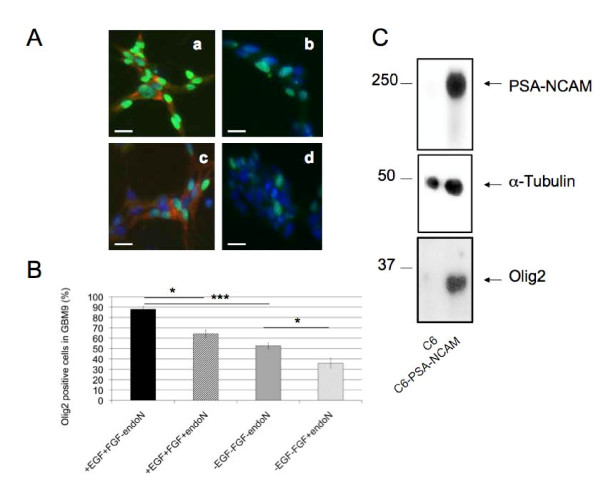
Figure 4.
Olig2 is positively correlated to PSA-NCAM. (A) Immunostaining of GBM9 cells with anti-olig2 (green, Alexa488) and anti-PSA-NCAM (red, CY3) in the presence of EGF + FGF (a), EGF + FGF + endoN (b), no growth factor (c), endoN and no growth factor (d). Cells were counterstained with DAPI (blue); scale bar: 20 μm. (B) Quantification of immunostaining described above from a representative experiment out of 2 performed. Percentage of olig2+ cells is presented as mean +/- standard deviation of the percentage of olig2+ cells grown in presence of EGF and FGF, from at least 5 independent fields of view per condition. Between 174 and 571 cells per condition were counted. (*: p < 0.05, ***: p < 0.001; Fisher's test). (C) Representative western blot out of 3 independent cultures of C6 and C6-PSA-NCAM with anti-PSA-NCAM, anti-α-tubulin and anti-olig2 antibodies.

