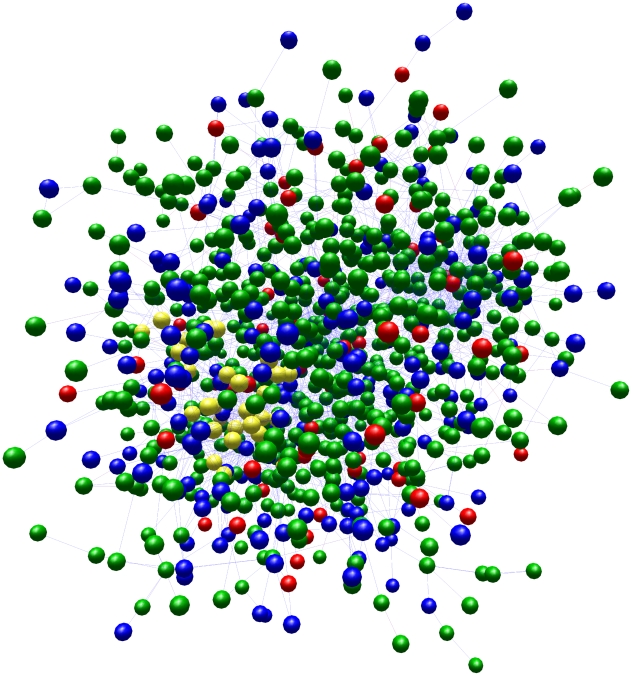
Figure 4. Variant surface glycoprotein (VSG) repertoire of T. b. brucei (927) represented as a three-dimensional network graph.
1258 T. b. brucei VSG protein sequences were compared using pairwise BLAST searches. BLAST scores were used to arrange VSG into a graph using BioLayout Express 3D 3.0. 968 individual VSG are represented as coloured spheres and are joined by edges to all other nodes with which they share >70% amino acid identity. The program minimizes the distance required to arrange all nodes such that related nodes are arranged closest to one another. Nodes are shaded by type: orthologous sequence in T. b. gambiense (blue), orthologous sequence in T. b. gambiense, but closest relative in T. b. brucei (green), no corresponding sequence in T. b. gambiense (red), metacyclic-stage VSG (purple) and VSG-related (VR) proteins (yellow).

