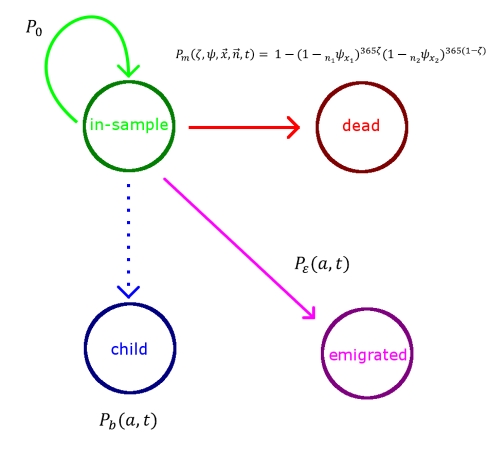
Figure 2. Simulated population model.
This schematic describes the evolution of the simulated population, where P 0 is the probability of remaining in the sample, P m is the probability of dying in the year given an age-specific probability ψ of dying in a single day (ζ is the fraction of time spent in the year in age group x 1), P ε(a,t) is the probability of migrating at age a and time t, and P b(a,t) is the probability of giving birth at age a and time t and only applies to the reproductive age groups.

