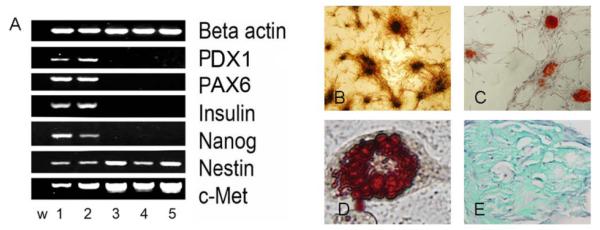
Figure 3. Characterization of the human pancreas derived MSC obtained in the three-step culture system.
(A) Gene expression profile of the pMSC determined at passage 7 by RT-PCR. First lane (w) is water. Lanes 1 and 2 represent cDNA obtained from collagenase digested 20 week-old human fetal pancreas no. 11492 and 17492. Lanes 3, 4 and 5 represent cDNA obtained from pMSCs derived from human fetal pancreas no: 11492, 17492 and 17498 after culture. Beta actin was used as an internal standard to normalize the amount of cDNA.
(B) In-vitro differentiation of pMSC into osteocytes. MSC were cultured and differentiated as described in methods. Mineralized bone nodules detected by von Kossa staining appear brown to black (original magnification × 10).
(C) In-vitro differentiation of pMSC into osteocytes detected by Alizarin red staining of the mineral deposits that appears bright red (original magnification × 10).
(D) In-vitro differentiation of pMSC into adipocytes. MSC were cultured and differentiated as described in methods. Adipocytes stained with Oil Red O for neutral lipids appear red (original magnification × 40).
(E) In-vitro differentiation of pMSC into chondrocytes. MSC were cultured and differentiated as described in methods. Chondrogenic differentiation was detected by Alcian green staining of the glucosaminoglycans that appear green (original magnification × 40).

