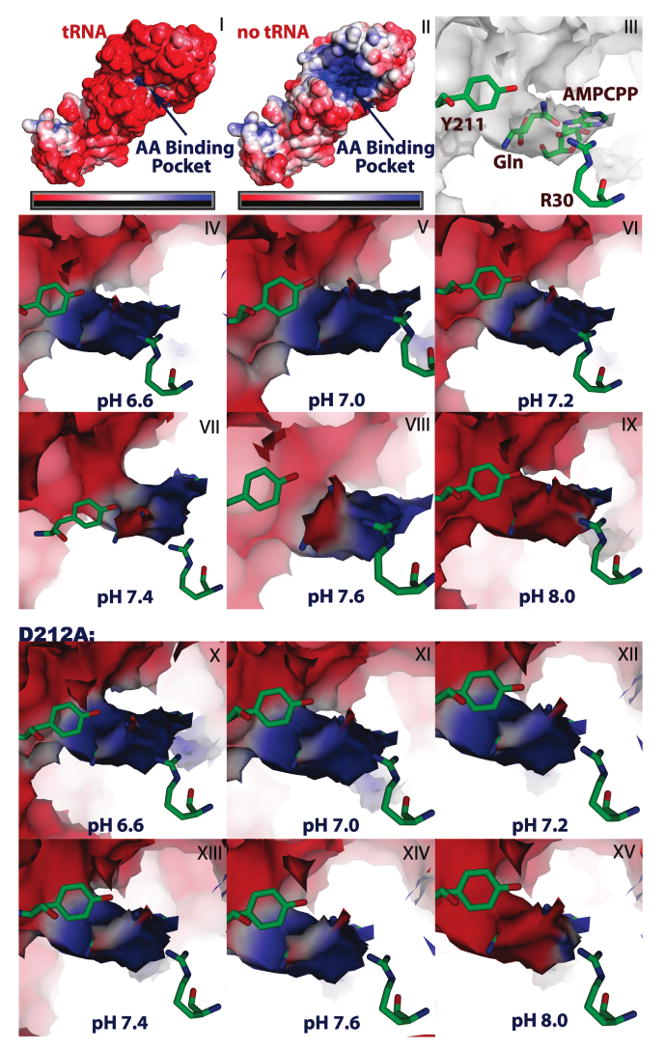
Figure 6.

Electrostatic surface potential rendering of the amino acid binding pocket of GlnRS. Panels I and II are a depiction of the potential at the GlnRS surface in the presence and absence of the tRNA acceptor stem. Electronegative surface potential is shown in red and electropositive surface potential is in blue, with the scale ranging from −5kbT/e to +5kbT/e. Panel III is a depiction of the amino acid binding pocket oriented from the inner cavity of the protein looking toward the outer surface. The amino acid and AMPCPP substrates are superimposed on the electrostatic surface potential with residues Y211 and R30 as reference points for visualization. Panels IV through IX demonstrate the change in the electrostatic potential of the amino acid binding cleft as a function of pH for the wild type enzyme, while panels X through XV demonstrate the pH dependency for D212A GlnRS.
