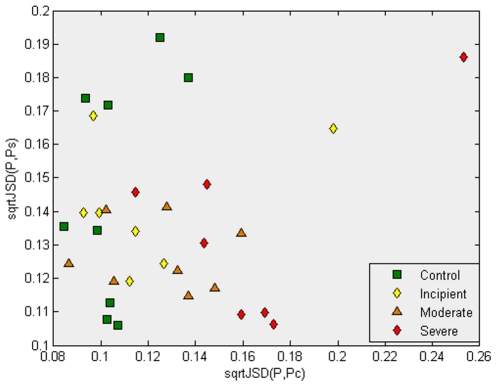
Figure 1. This plot illustrates that the third step of our methodology, the use of the Jensen-Shannon divergence, does not appear to give an interesting separation of the samples in the absence of a previous feature selection step.
For this graph, all 22,215 genes were considered in the calculation of the average profile of the samples in the “Control” and “Severe AD” classes. The square root of the Jensen-Shannon divergences to the “Control” and “Severe AD” average profile are computed, respectively giving, for each sample, its x and y coordinates in this plot. Observe that most of the “Control” samples have values lower than 0.12, with two exceptions. This result is expected, as the probability distribution function of the “Control” class was used. However, most of the samples from AD patients (having either “Incipient AD”, “Moderate” or “Severe” labels), show a divergence with the Control average gene expression profile. Figure 2 shows the important contribution provided by the feature selection step.

