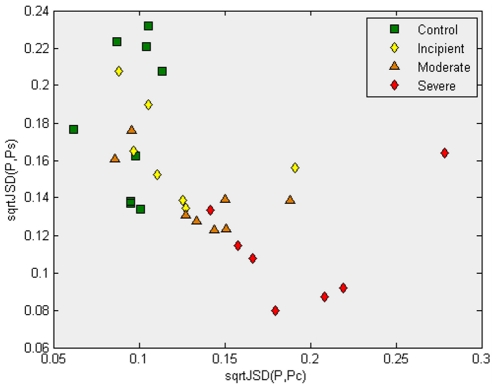
Figure 2. This plot illustrates that after application of the feature selection steps, followed by the computation of the gene expression profile's average profile of the samples in the “Control” and “Severe AD” classes (now on a set of 1,372 probes), the samples are now more clearly separated.
Here, all “Control” samples have the square root of the Jensen-Shannon divergences to the average gene expression of the “Control” samples (x-coordinate) smaller than 0.12 (almost all severe AD have x-coordinates greater than 0.15). In addition to that, most samples labelled “Severe AD” are located on the same region. Both results are expected. However, it is interesting that in this (x,y)-plot most samples that are labelled “Incipient AD” or “Moderate AD” seem to “bridge” between the regions that have most of the “Control” samples and the region that have most of the “Severe AD” group. This result is interesting as no samples from “Incipient AD” nor “Moderate AD” have been used in the first three steps of our methodology. In essence, the work is a “test set” indicating that it is reasonable to expect that some genes in the genetic signature of 1,372 probes have information about a putative “progression” trend of the disease, from the “Control” to the “Severe AD” profile. In what follows, correlations across all the samples with these divergences are used as a method to try to identify those gene profiles that are most correlated with the progression from “Control” to “Severe AD”.

