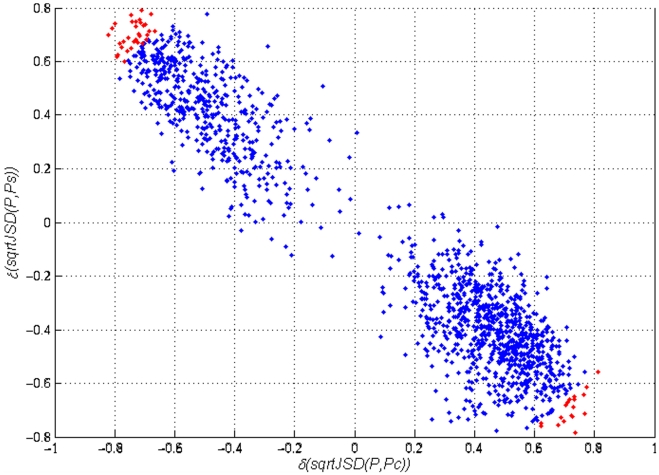
Figure 4. Correlation of the expression profiles of 1,372 probes (across samples) with the sqrtJSD of the samples of two reference groups (“Control” and “Severe AD”, represented by the average expression profile in the group).
The 50 probes in red are those most distant from the origin of this system of coordinates. Those probes have expression-value variations that are correlated with the divergences of the average “Control” profile and at the same time with the “Severe AD”.

