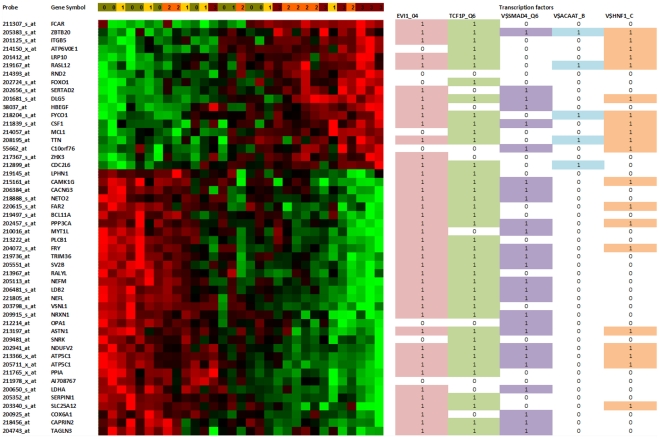
Figure 7. Heat map of the 50-probe signature and the transcription factors with best p-values, for the whole set of 50 probes and for the two groups considered.
The samples and probes were sorted using the memetic algorithm given in [12], using the Euclidean distance. The transcription factors were obtained using Chang and Nevins' GATHER system to interpret genomic signatures [634]. The coloured cell and the number 1 indicate that the transcription factor has a binding motif with the gene for that row. The levels of severity as defined by Blalock et al. [635] are indicated in the first line: (0) Control, (1) Incipient AD, (2) Moderate AD and (3) Severe AD.

