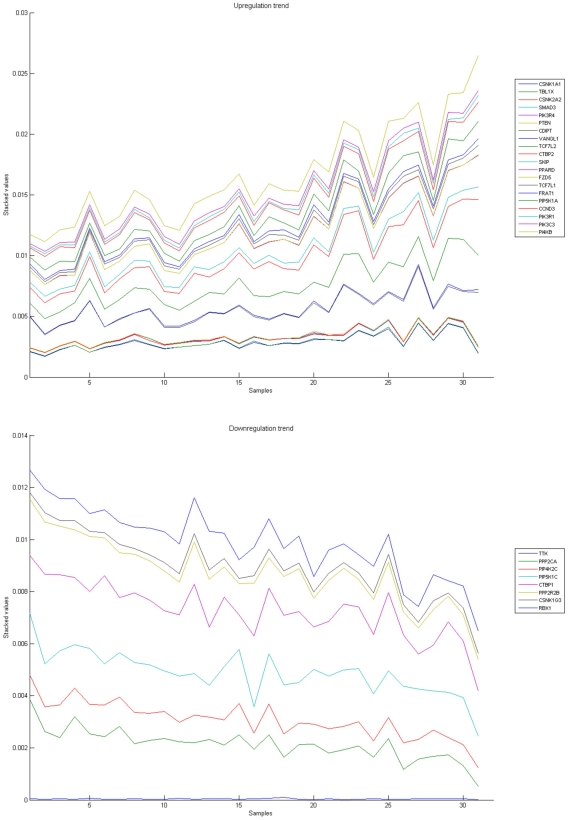
Figure 13. Phosphatidylinositol signaling pathway.
The upper graph presents the stacked normalized expression values of all the probes involved in the pathway with an upregulation trend. The lower graph analyses the genes involved in the pathway with a downregulation tendency. In the supplementary material (File S3 sheet ‘Phosphatidylinositol signalling’), the reader will find all the individual gene expression values, normalised and not normalised.

