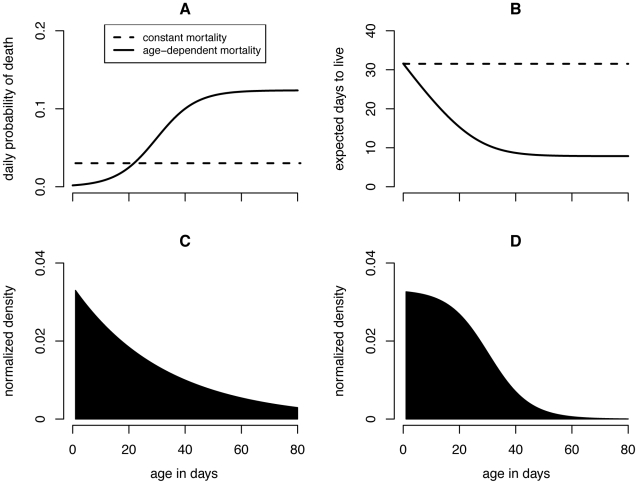
Figure 1. Mortality functions and mosquito demography.
Panel (A) depicts the daily probability of death p(x) as a function of age for both the constant mortality model and the best fit logistic age dependent model to Styer et al. (2007)'s data. The resulting life-expectancy curves are displayed in (B); in both cases the life expectancy of a newly emerged adult mosquito is 32 days. In (C) and (D) the age distributions of a mosquito population experiencing constant and age dependent mortality, respectively, are shown. The number of mosquitoes has been normalized so that the total population density equals 1.

