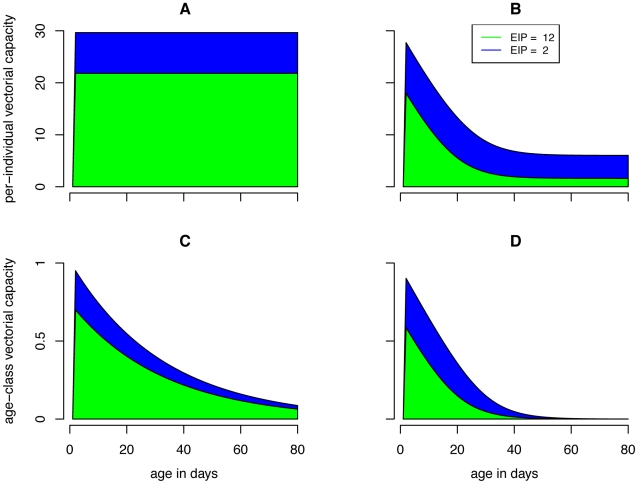
Figure 2. Vectorial capacity contribution by age and age class.
Panels (A) and (B) show the individual-level contribution to scaled vectorial capacity (C*) by age; and panels (C) and (D) show the contribution of each age class to C*. The left panels assume constant mortality rates while the right panels assume age dependent mortality rates. Pathogens with shorter extrinsic incubation periods (EIP) allow mosquitoes to transmit sooner after they become infected. For that reason, mosquitoes of all ages contribute more to C*. The blue region shows the extra C* contributed for an EIP of 2 in addition to that for an EIP of 12 given all else held constant. The sensitivity of C* to the EIP is more dramatic in the age dependent model (D) compared to the constant model (C).

