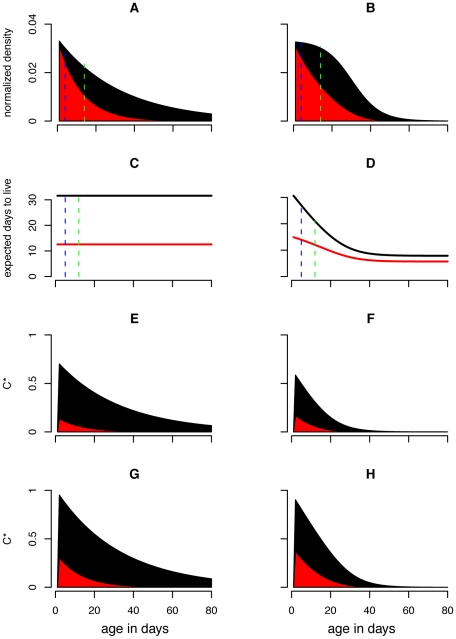
Figure 3. Effects of reduced mosquito survival on demography and vectorial capacity.
The above figure displays the effects of reducing mosquito survival (rA = 0.05, red) compared to a baseline scenario (rA = 0, black) on the mosquito population distribution (A,B), the life expectancy function (C,D) and the C* contributions by age class for extrinsic incubation periods of 12 days (E,F) and 2 days (G,H). The left column of panels (A,C,E,G) displays results from the constant mortality model while the right column of panels (B,D, F, H) show results from the age dependent mortality model. The proportional reduction in C* due to reducing survival is greater for the constant model than for the age dependent model, and greater for the longer EIP. The green and blue dashed lines in the first two rows indicate the youngest age at which mosquitoes can be infectious when the EIP is 2 and 12 days, respectively. Because C* can be calculated by summing across ages old enough to be infectious the product of mosquito density and life expectancy (Equation 12), these dashed lines can be used to visually inspect how the first two rows of panels yield the second two. The region between the dashed lines in panels A and B consist of the mosquitoes who are too young to be infectious for an EIP of 12 days but are old enough to be infectious for an EIP of 2 days. While the proportional reduction of these age classes due to reducing mosquito survival is relatively small compared to older mosquitoes, the proportional reduction in life expectancy in these age classes is quite large. These effects almost balance each other out such that interventions that reduce mosquito survival are only slightly less efficient for shorter EIPs (see Figure 5).

