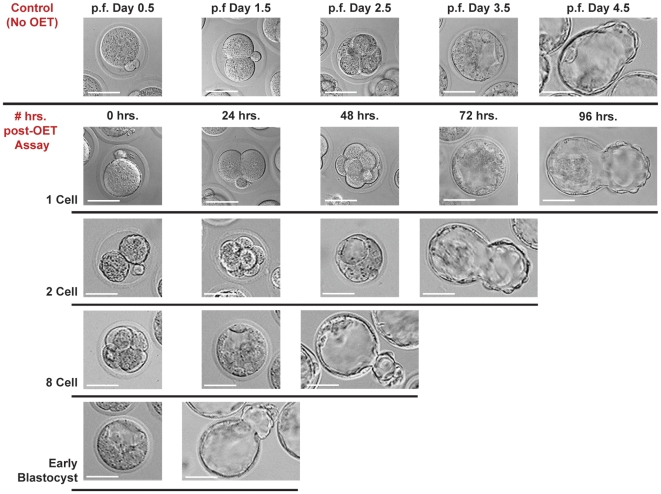
Figure 3. Viability of Embryos Post-assay.
Representative pictures of embryos assayed in OET versus control group (not assayed in OET) at varying stages of development (1-cell, 2-cell, 8-cell, early blastocyst) and re-cultured in KSOM+AA media. Control group pictures are shown at 24 hour intervals post-fertilization (p.f.) starting at the 1-cell stage (p.f. Day 0.5) till the hatched blastocyst stage (p.f. Day 4.5). Post-OET Assay pictures were taken at 24 hr. intervals (following OET assay) until the embryos reached the hatched blastocyst stage. Nearly all (90–95%) assayed embryos, at all stages of development, progressed to the hatched phase. Scale bar 50 µm.

