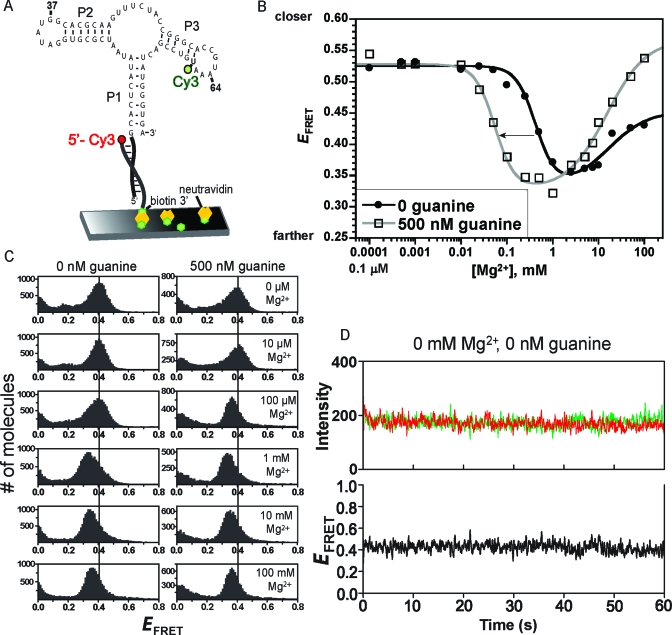
Figure 3.
Ensemble and single-molecule FRET analyses of the P1−P3 aptamer domain variant. (A) Design of P1−P3 for smFRET analysis. For ensemble FRET, the neutravidin surface was omitted. (B) Ensemble FRET titration of P1−P3 with Mg2+ at 0 or 500 nM guanine. Each curve was fitted to a standard two-component titration curve with Hill coefficients of 2 and 1 for the low- and high-Mg2+ components, respectively (39). (C) smFRET histograms for P1−P3. The vertical guideline is at an E of 0.4. (D) Representative single-molecule smFRET time traces for P1−P3.

