
Figure 4. VASP phosphorylation is important for its colocalization with F-actin upon cAMP stimulation.
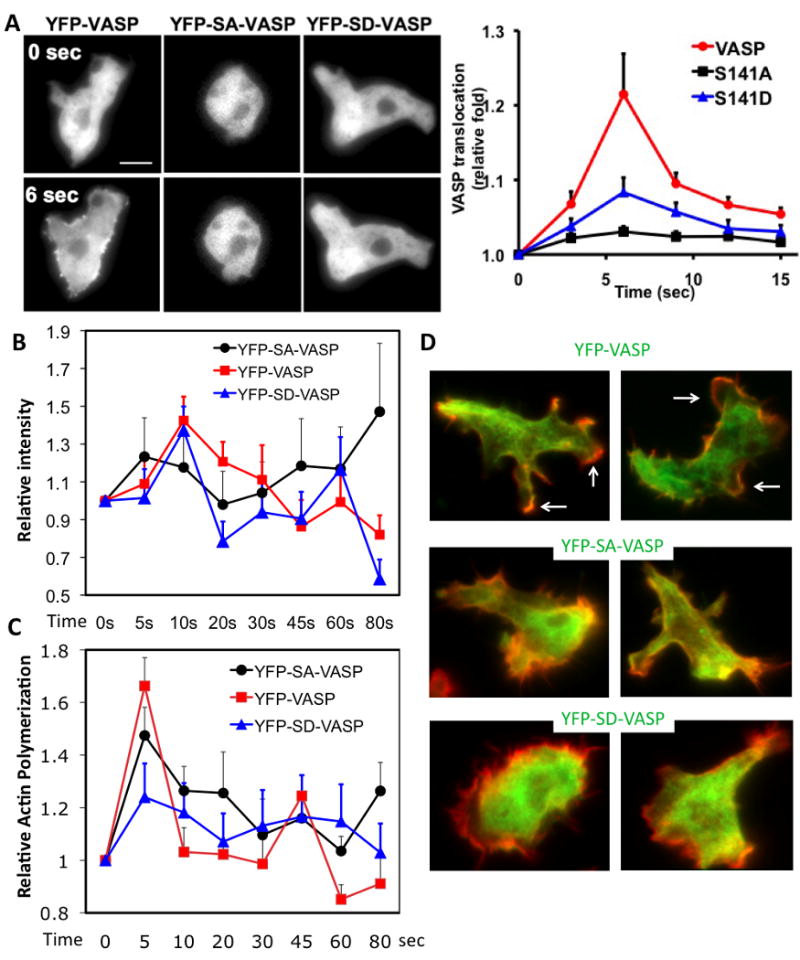
A, Cells (VASP, SA, SD) pulsed for 5-hrs were stimulated uniformly with cAMP (100 nM). Images before (-) and after cAMP stimulus for 6 sec (+) obtained from time-lapse recordings are presented. Right panel shows translocation kinetics of VASP in response to cAMP. Translocation was quantitated using the linescan analysis. Translocation was defined as the ratio of the average pixel intensity at cortex to pixel intensity in the cytosol. 4-6 lines were drawn for individual cells. Data presented as mean ± SEM. The translocation is normalized by 0 time point. Scale bar represents 5 μm. B, Association of YFP-VASP into DIF upon cAMP stimulation. DIF was prepared at different time points after cAMP stimulation and YFP-VASP associated with the DIF was detected by western blot. C, Changes of F-actin polymerization in DIF after cAMP treatment. D, Colocalization of VASP or mutants with F-actin after cAMP stimulation. Cells were fixed at 60 sec after cAMP stimulation and stained with Texas-Red labeled phalloidin. Images were taken in both YFP (green) and Texas-Red (red) channels and overlaid to show colocalization. Arrows indicate pseudopods where VASP and F-actin colocalize.