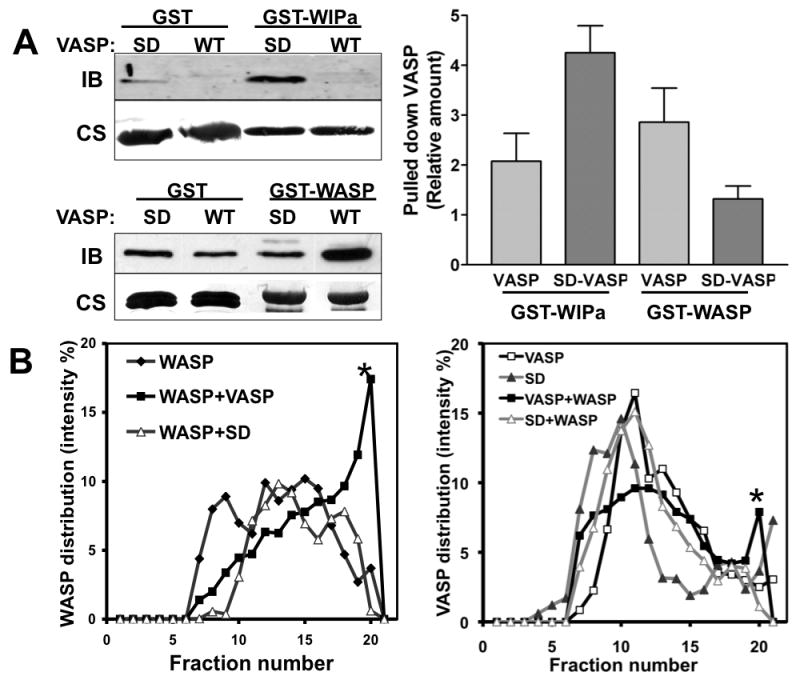
Figure 5. VASP phosphorylation determines the binding affinity to WIPa and WASP.

A, Recombinant 6×His-tagged VASP and SD-VASP proteins were precipitated with GST-fusion WIPa and WASP proteins bound to glutathione beads. Samples were subjected to immunoblotting (IB) probed with anti-VASP antibody. The same blot is further stained with Coomassie blue (CS) to visualize GST proteins (left, lower). Band intensities of pulled-down VASP in 3-4 individual experiments were quantitated and normalized to the quantity of GST-tagged protein used in the experiment (right). The pulled down VASP by GST-only beads is considered as 1 in the graph. B, Density gradient analysis of the interaction of VASP with WASP. Equal amounts of His-VASP and GST-WASP proteins were preincubated and subjected to ultracentrifugation on an Optiprep gradient (5-20%). Collected fractions were run on a SDS-PAGE gel and stained with Coomassie blue. Relative amounts of His-VASP (∼50 kDa, left) and GST-WASP (∼ 70 kDa, right) bands from each fraction were quantified and plotted. BSA (∼65 kDa) was also run as a protein marker in an additional gradient (5-20%) and is present after fraction 19 (not shown). Stars indicate the GST-WASP (left) or His-VASP (right) or in the higher concentration of Optiprep fractions when VASP and WASP are both present in the reaction.
