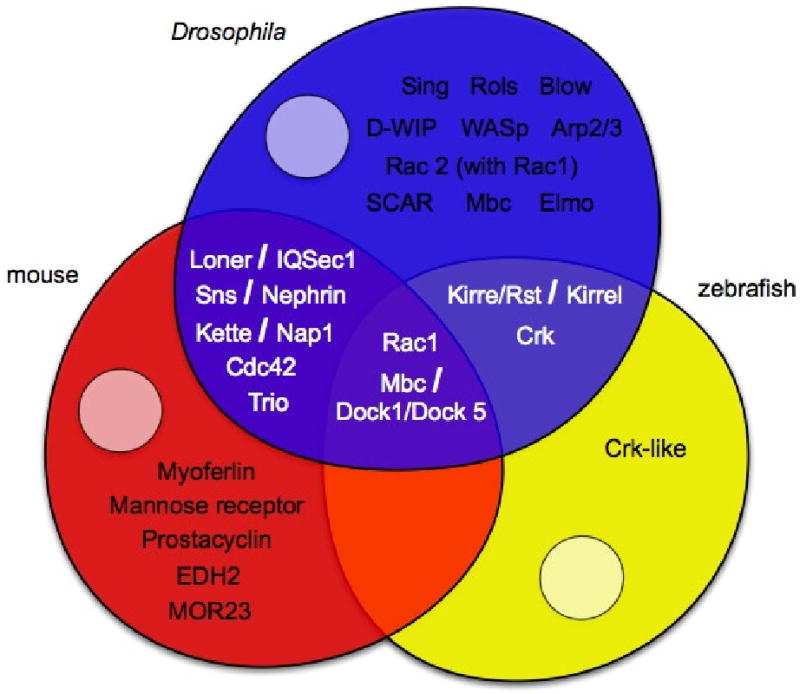
Figure 6. Venn diagram depicting a subset of genes that have been analyzed in each model system.

The model systems Drosophila, mouse and zebrafish are illustrated as blue, red and yellow partially overlapping myoblasts. A subset of genes analyzed to date are listed in each myoblast. Genes unique to a model organism are located in non-overlapping, monochromatic regions of the suitable myoblast. Genes that have been studied in multiple models are localized to the appropriate overlapping regions. Genes that have been analyzed in more than one system are phenotypically compared in Table 3.
