
Figure 1.
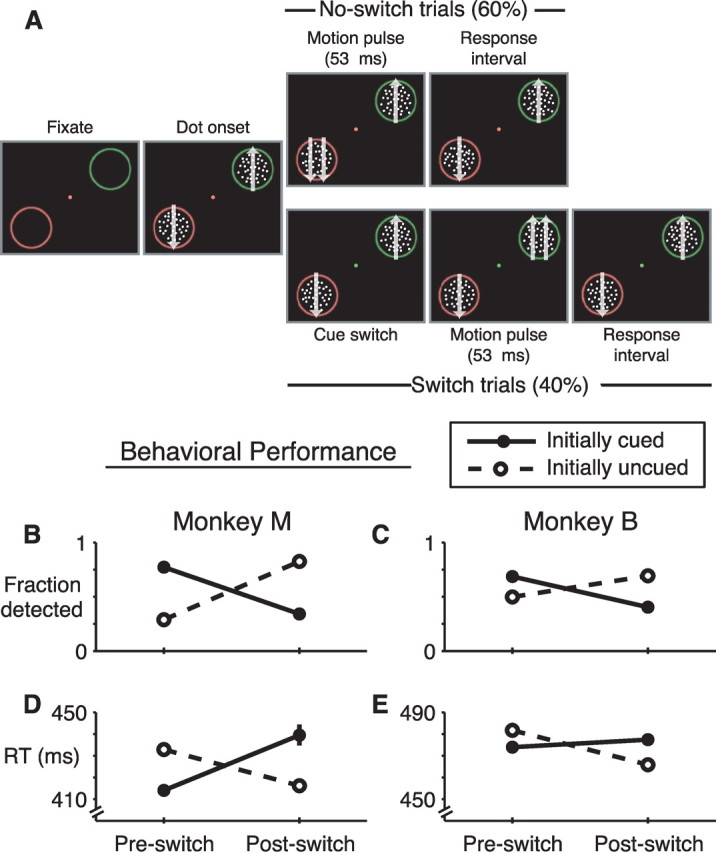
Task design and behavior. A, Attention-switch task. Trials began with the appearance of a fixation point and two peripheral annuli. After fixation, 100% coherent moving dots appeared within the annuli. The monkey released a touch bar to indicate detection of a 53-ms-duration speed increase at either dot patch. Matching fixation point and annulus color indicated the likely location of the speed pulse (85% valid cues). On 40% of trials, the fixation-point color switched mid-trial, indicating that the likely speed-pulse location had switched. After a 400 ms fixed delay, speed-pulse times and cue-switch times were chosen from an exponential distribution (mean of 1 s). B–E, Behavior from neural recording sessions. Monkey M (B, D) and monkey B (C, E) exhibited increased detection frequency (B, C) and decreased reaction times (D, E) when speed pulses occurred at the initially cued location (filled symbols, solid lines) relative to the initially uncued location (open symbols, dashed lines). After cue switches, this behavioral pattern reversed. Error bars are 95% confidence intervals for data pooled across all behavioral sessions (generally smaller than the symbols). All valid/invalid differences were statistically significant (p ≪ 0.001, χ2 test for fraction detected, t test for reaction time).