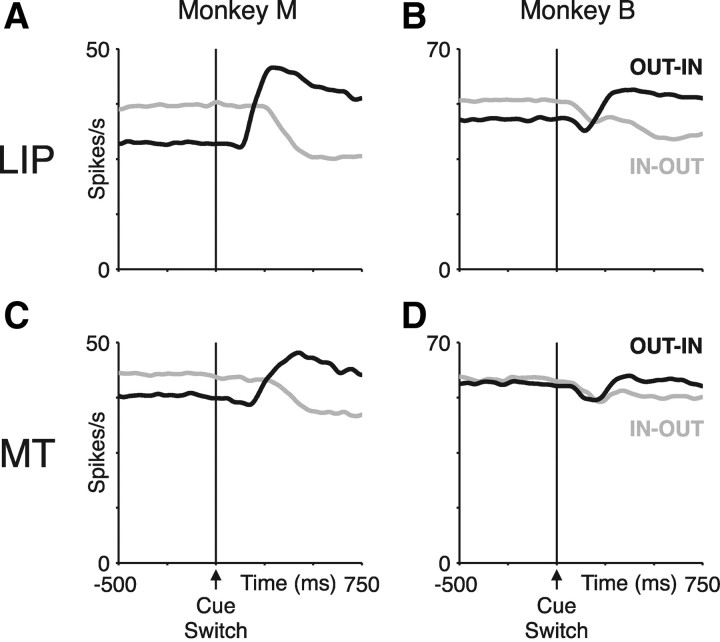
Figure 3.
Population neural activity in LIP and MT. A, B, LIP average population activity on switch trials aligned on the time of the cue switch for monkey M (A) and monkey B (B). Trials in which the initially cued dot patch was in the receptive field (in–out switches, gray) and out of the receptive field (out–in switches, black) are plotted separately. The sign of the attentional modulation switched shortly after a cue switch. C, D, MT average population activity on switch trials aligned on the time of the cue switch for monkey M (C) and monkey B (D).

