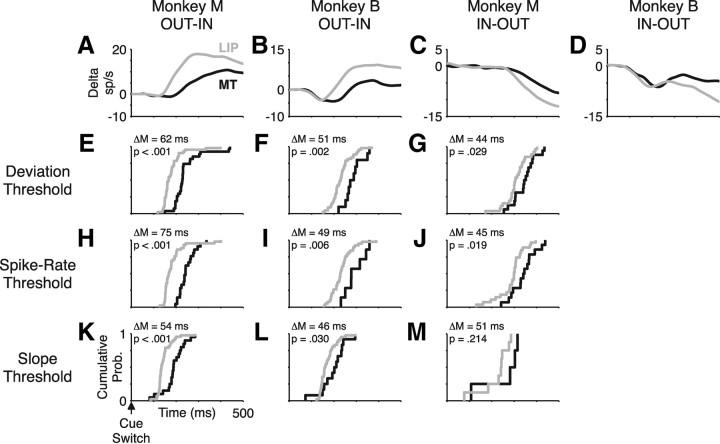
Figure 5.
Single-neuron attentional latencies. LIP data are in gray, and MT data are in black. A–D, Peri-cue-switch spike-rate functions for monkey M out–in switches (A), monkey B out–in switches (B), monkey M in–out switches (C), and monkey B in–out switches (D). Spike-rate functions are aligned vertically to have overlapping spike rates from 0 to 50 ms after the cue switch (A, B, D) or from 0 to 150 ms (C) after the cue switch but are not otherwise scaled. E–M, Cumulative probability distributions for single-neuron attentional latencies. Single-neuron latencies could not be determined for monkey B in–out switches because of the postcue dip in activity. Latencies were determined using deviation-threshold (E–G), spike-rate-threshold (H–J), and slope-threshold (K–M) methods. Inset values are the difference of population medians (ΔM) between the LIP and MT distributions and a p value from a Wilcoxon's rank-sum test for the null hypothesis of no difference between the distributions.

