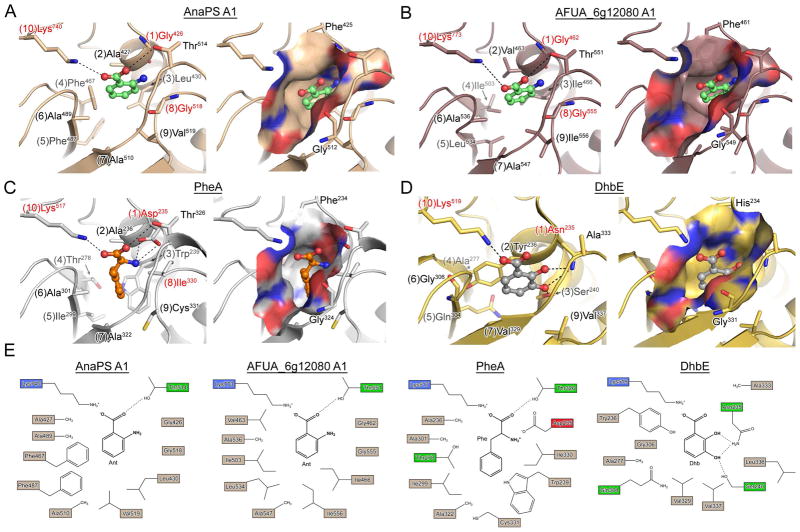
Figure 5.
Homology models and crystal structures of NRPS adenylation domains. (A) and (B) are homology models of the proposed Ant-activating A-domains of AnaPS module 1 and AFUG_6g12080 module 1, respectively (PheA used as template). Anthranilic acid was manually docked into the binding pocket based on the PheA and DhbE structures and is rendered as green ball-and-stick. (C) Crystal structure of PheA (PDB ID: 1AMU) bound to AMP and L-Phe (orange ball-and-stick). (D) Crystal structure of DhbE (PDB ID: 1MDB) bound to 2,3-dihyhydroxybenzoyl-AMP (2,3-DHB rendered as grey ball-and-stick). For (A)-(D), left image shows specificity-determining residues as sticks, with potential hydrogen bond and/or ionic interactions drawn as dashed lines. Numbers in parenthesis preceding the residue label indicate residue position according to the 10AA specificity code. Right image presents a molecular surface representation of the substrate binding pocket colored according to electrostatic properties (blue = positive, red = negative), and includes two residues which are conserved among A-domains as Gly and Phe/His/Tyr. (E) 2D representation of the substrate selectivity residues for panels (A)–(D).

