
Figure 1. Schematic of Two Dimensional Fast Fourier Transform Measurements in Mineralized Bone.

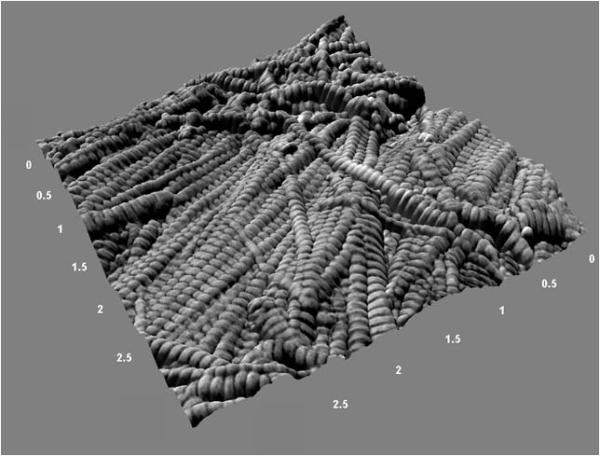
Panel a shows a representative 3.5 μm × 3.5 μm amplitude (error) image that was used to measure the collagen fibril axial D-periodicity. The yellow box represents a fibril that was chosen for measurement. Panel b shows the corresponding 2D FFT from this fibril. As indicated, the 2D spectrum contains information about the harmonic characteristics of the fibril. The circled peaks are the first harmonic in the spectrum. The maximum value in this peak corresponds to the axial repeat distance of the fibril (in this case, 68 nm).