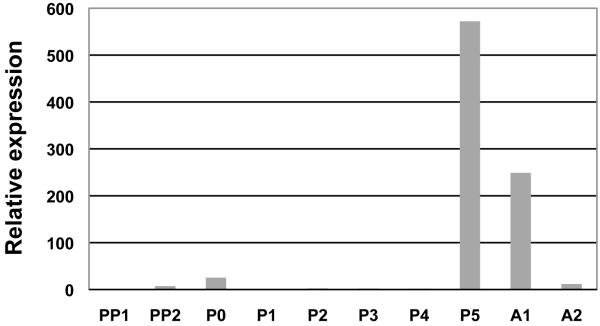
Figure 2.
Developmental expression profile of TH. The level of transcript abundance relative to that of rpS6 in whole insects was determined by quantitative RT-PCR. PP0, 0-1 d-old pharate pupae; PP1, 1-2 d-old pharate pupae; P0, 0 d-old pupae; P1, 1 d-old pupae; P2, 2 d-old pupae; P3, 3 d-old pupae; P4, 4 d-old pupae; P5, 5 d-old pupae; A0, 0 d-old adults and A1, 7 d-old adults. Expression levels for TcTH are presented relative to the levels of expression in the earliest developmental stage analyzed (PP0).

