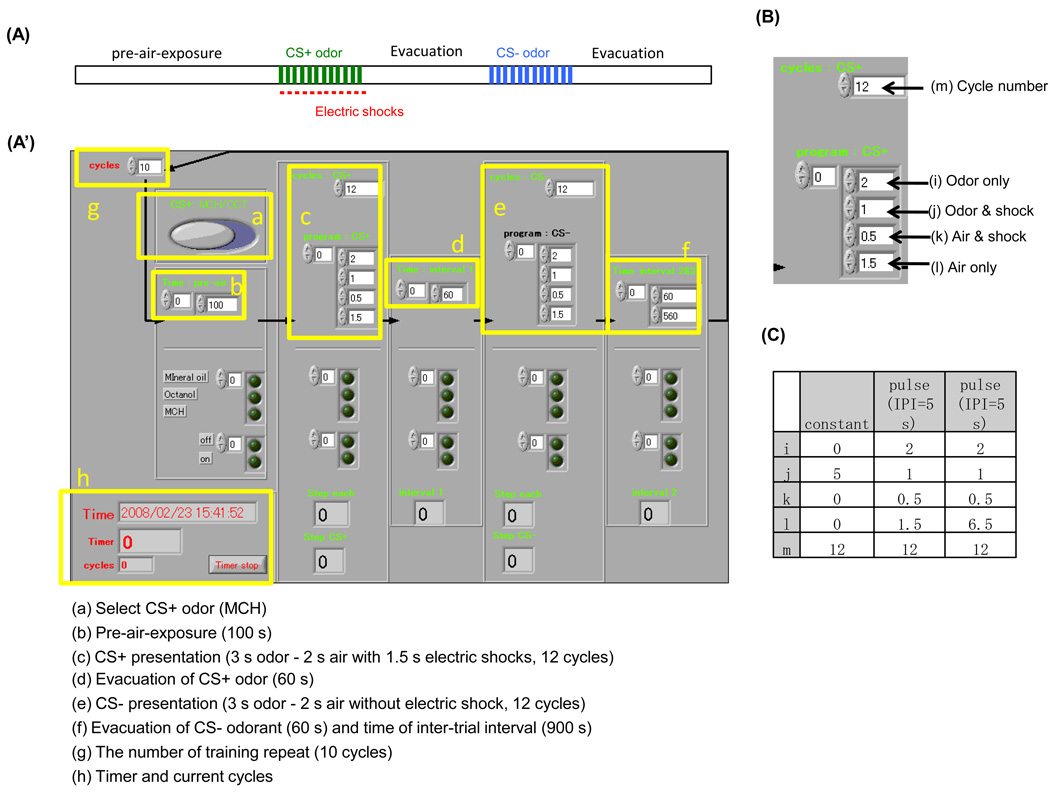
Figure 2. Front panel of Labview program for olfactory conditioning.
(A) A schematic diagram showing pulsed odor delivery protocol used in this study. (A’) Labview front panel used for olfactory conditioning. Upper area is used to set experimental parameters (a-h). Lower area is used to monitor ongoing procedures. A current cycle and time are indicated in box h. (B) A magnified image of box c. (C) Parameters used for constant or pulsed odor delivery protocols. Letters (i-m) correspond to those in B. The same parameters were always used for CS+ and CS−.

