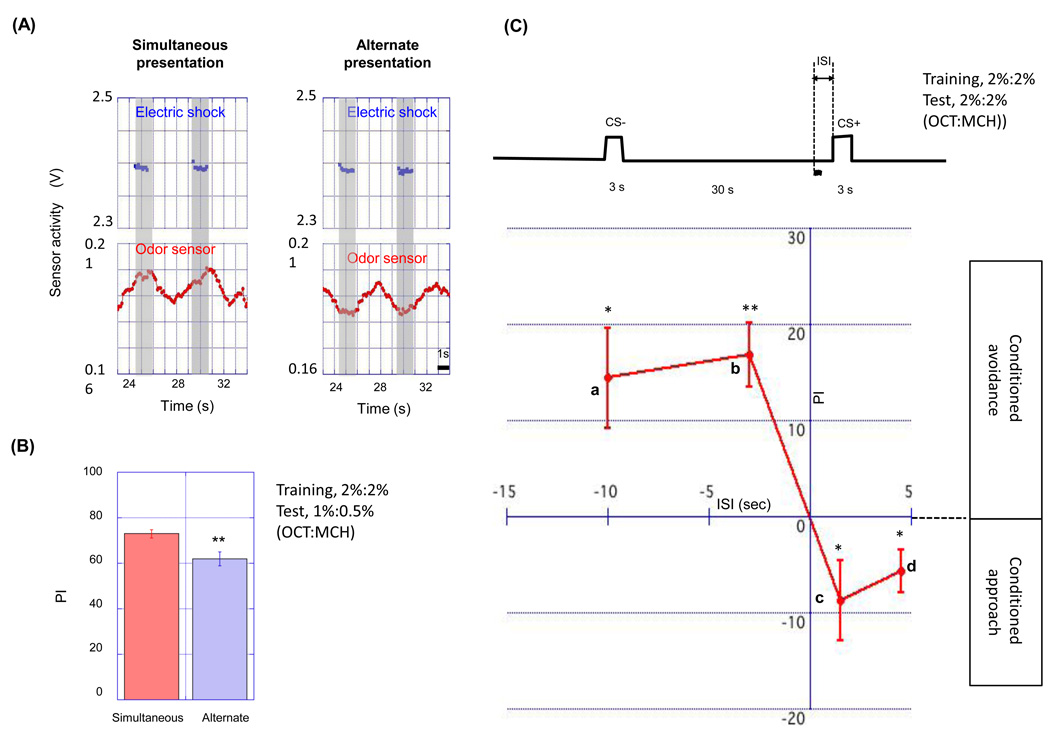
Figure 8. The importance of the timing between electric shocks and odor pulses in pulsed flow.
(A) Plots represent odor sensor activity (red dots) in the pulsed flow protocols. Blue dots represent electric shocks. In the simultaneous presentation program (left) electric shocks were presented when odor concentration was rising and were terminated when odor concentration was dropping. In alternate presentation program (right), odor pulses were presented between electric shocks. (B) PI of flies trained by simultaneous or alternate presentation protocol. PI was measured 3 min after the training. The alternate presentation program resulted in a lower performance than the simultaneous presentation program (n=10, **p<0.01, t-test). (C) The scheme of short training protocol with pulsed stimuli. Flies were pre-exposed to CS- odor 30 s before the CS+ presentation that is paired with an electric shock (a wavy line). The timings of an electric shock (1.5 s duration) and a CS+ odor pulse (3 s duration) were variously changed. Timings are represented by interstimulus interval (ISI). Plus ISI means that an electric shock precedes a CS+ odor pulse. On the other hand, minus ISI means that an electric shock was presented after the onset of CS+ odor pulse. An electric shock preceding odor pulse induced conditioned approach to CS+ (c, d in the graph), while an electric shock presented after the onset of odor pulse resulted in conditioned avoidance to CS+ (a, b in the graph). Data are presented as mean ±SEM (n=6 for each timing, *p<0.05, **p<0.01, t-test).

