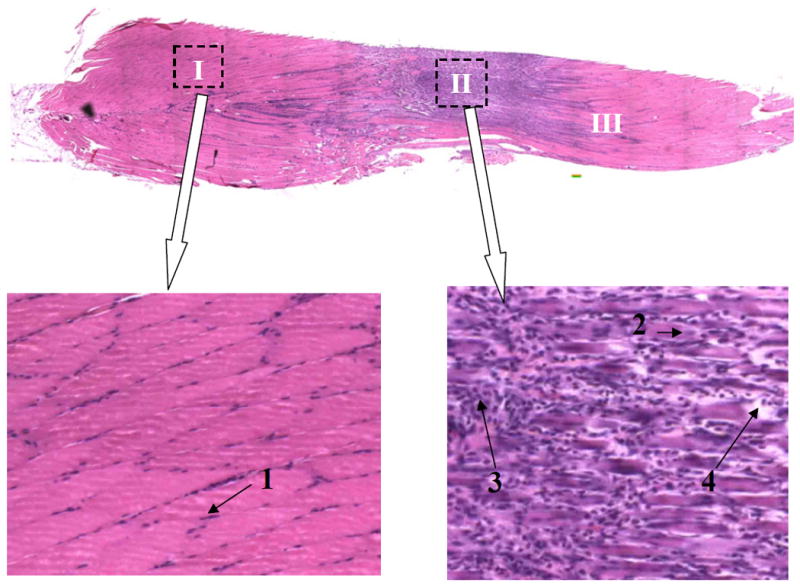
Fig. 6.

A sample longitudinal section (an assembled mosaic picture) taken from a rat in Neuro-Intact group. Clear definitions between healthy tissue (I) and the injury area (II) can be seen. Normal fibers show peripheral nuclei (arrow 1). Darker areas show centralized nuclei (arrow 2), phagocytes infiltration (arrow 3) and degenerated fibers (arrow 4); all indicating tissue damage and repair. Further tissue damage is seen (III) away from the center of injury (II), indicating continuing tissue necrosis. Stain: H & E. Image: 50x Magnification.
