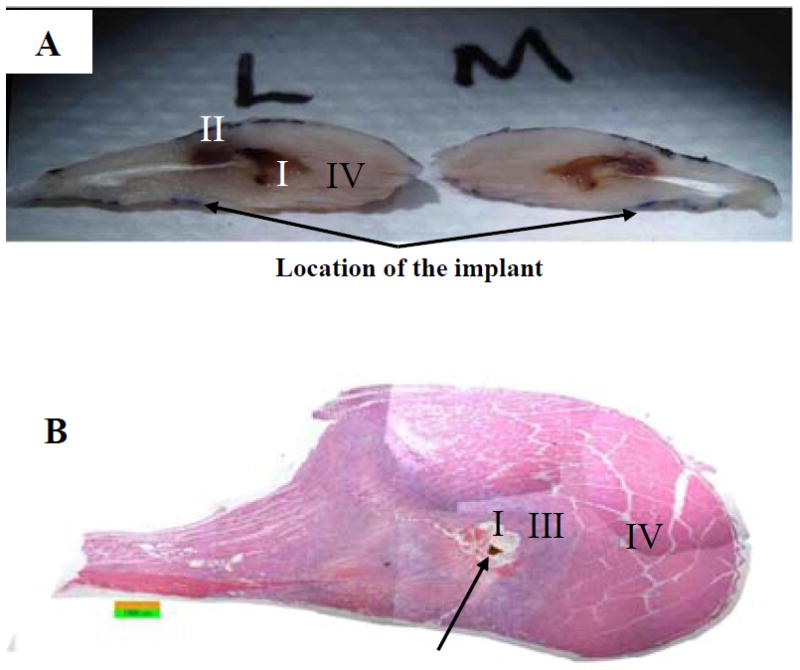
Fig. 7.

An assembled mosaic picture for the most extreme tissue damage observed from the right TA of an Implant-DTI rat with compression of 400mmHg of 24 hours. Figure A shows a photograph of the dissected TA. The muscle was bisected longitudinally to reveal the formed deep pressure ulcer. The lateral side (L) and the medial side (M) of the TA both show an evenly distributed cavity that clearly shows necrotic tissue at and distal to the lesion (I and II) and healthy tissue (IV) proximal to the cavity. Figure B is a longitudinal section from the same TA that also shows the formation of the deep ulcer (I) as well as heavily damaged (III) and healthy tissues (IV). Histology observation also shows a calcification possibly due to extremely damage to the muscle tissue (arrow). Stain: H & E. Image: 50× Magnification.
