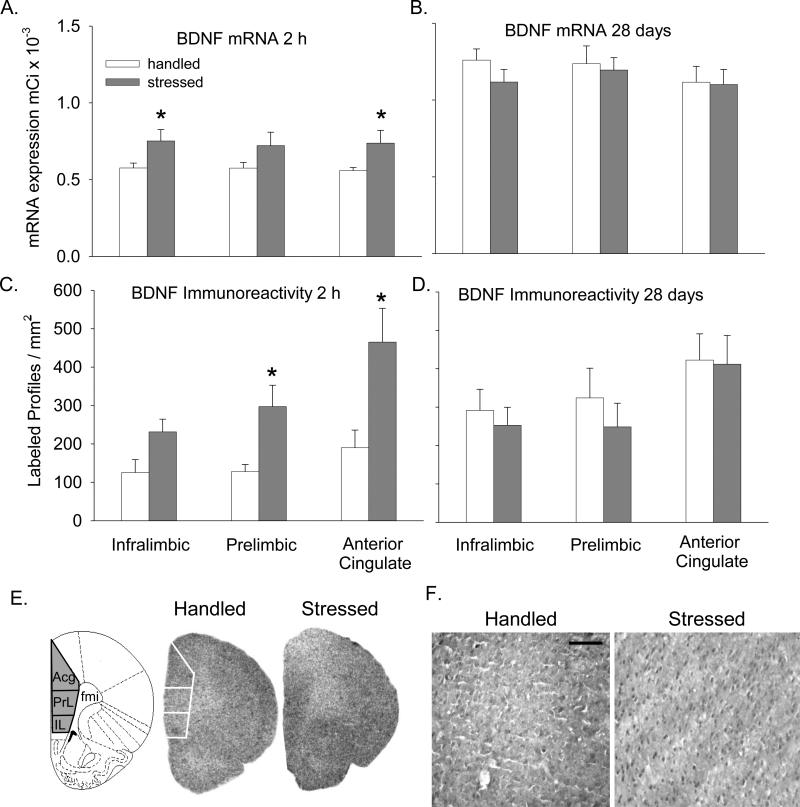
Figure 1. Effect of intermittent stress on BDNF in the PFC.
BDNF mRNA labeling in the IL, PrL, and ACg subregions of PFC in film autoradiographs expressed as μCi/g of calibrated radiostandard: A - 2 h after termination of stress (n=5-6) and B - 28 days later (n=5-6). BDNF immunolabeling expressed as labeled profiles / mm2 in the IL, PrL, and ACg subregions of the PFC: C - 2 h after termination of stress (n=4-6) and D - 28 days later (n=5-6). All values represent mean ± SEM. E - Schematic representation of locations of PFC subregions; fmi – forceps minor. Representative autoradiographs of PFC showing BDNF mRNA signal intensity 2 h after stress; white lines indicate boundaries of regions analyzed. F - Representative photomicrographs taken from ACg region showing BDNF immunolabeling 2 h after stress. Scale bar in F indicates 100 μm. *- p<0.05.

