
Figure 3.
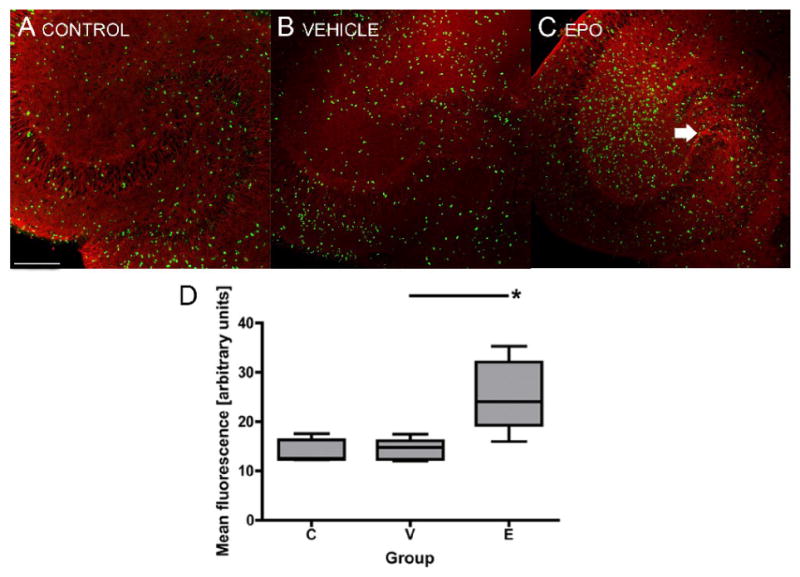
Tuj1 and BrdU expression in OHSC 5 days after OGD. The vehicle treated group (B) showed less Tuj1 expression in the hilus of the dentate gyrus and surrounding the CA3 region than the control group (A), while EPO treated group (C) showed Tuj1 expression similar to that in the control group (arrow). In EPO treated group, there were more BrdU positive cells in the dentate gyrus 5 days after OGD, compared to the control and vehicle treated groups (D). Red, Tuj1; green, BrdU; scale 200 μm; boxes: quartiles, mean, SEM; *, p < 0.01.