
Figure 4.
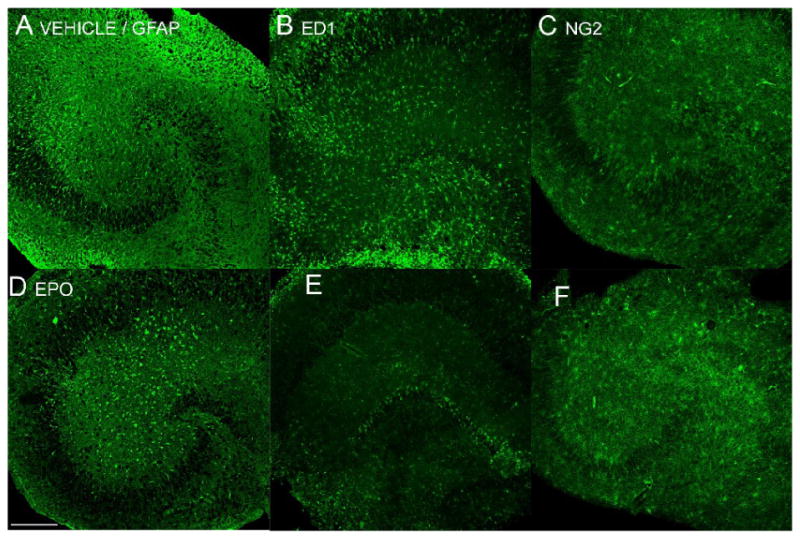
Qualitative comparison between the vehicle treated group (A, B, C) and EPO treated group (D, E, F) of OHSC in expression of markers for astrocytes (GFAP; A, D), microglia (ED1; B, E), and oligodendrocytes (NG2; C, F). EPO treated OHSC express less GFAP and ED1 immunoreactivity, while expressing more NG2 immunoreactivity 5 days after OGD. Scale 200 μm.