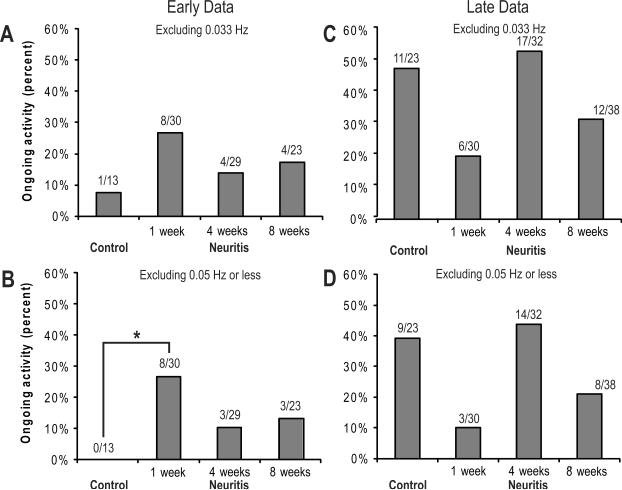
Figure 4.
The effect of neuritis on OA incidence over time, comparing neurons recorded within the first hour (early) to those recorded later in the experiment (late) neurons (see text) When neurons with the slower OA rates (A and C: <0.033 Hz; B and D:<0.5 Hz) are removed, a clear pattern develops for the early-recorded neurons (A, B), revealing that neuritis most likely causes ongoing activity peaking at 1 week and becoming less at 4 and 8 weeks. The data from the later-recorded units (C, D) do not fit any pattern, regardless of whether the very slowly discharging neurons are included. * p = 0.04, One-way Fisher exact test comparing control with one week neuritis.

