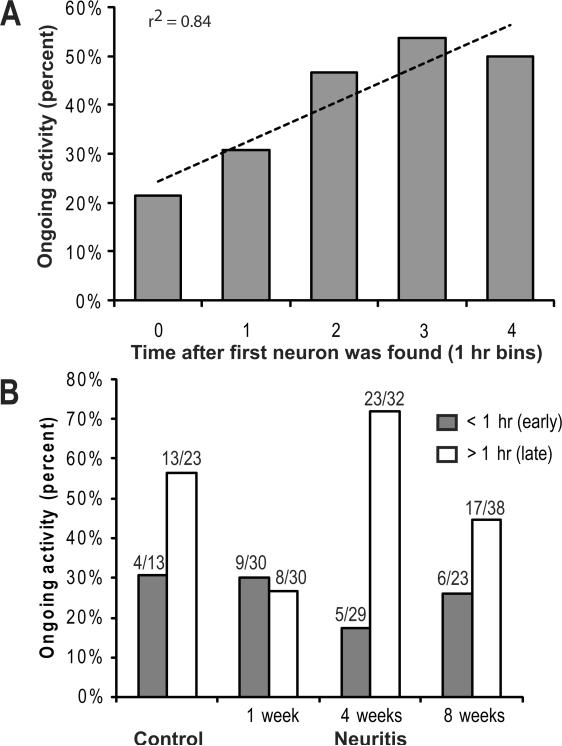
Figure 5.
A. The percentage of neurons exhibiting OA increased with time after the localization of the first unit. These data are all from dorsal root recordings, from all time points, including control and 1, 4, and 8 weeks following the induction of sciatic neuritis. B. Percentage of neurons with OA, recorded at the dorsal root, separated by time during the experiment. More neurons exhibited OA later in the experiment.

