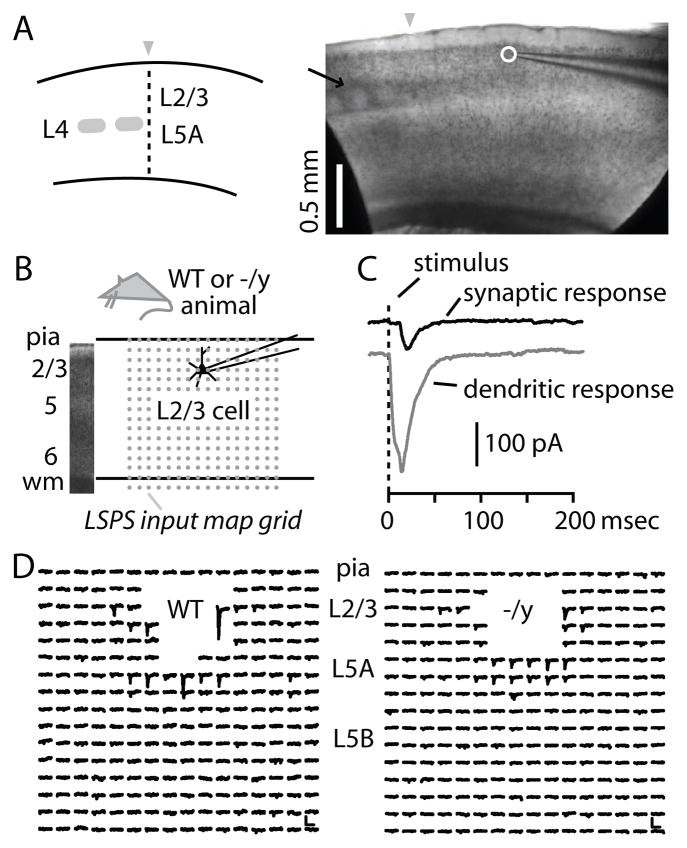
Figure 4. LSPS mapping methods.
(A) Schematic (left) and bright field image (right) of parasagittal slice with motor-frontal cortex. Anterior is to the right. Arrow: L4 barrels in S1. Arrowheads: S1-M1 border. Circle: soma of recorded neuron.
(B) Bright field image (left) showing cortical layers, and schematic (right) depicting recording arrangement and 16 × 16 site stimulation grid with 0.1 mm spacing (array of dots). Top and bottom lines represent pia and white matter, respectively.
(C) Examples of dendritic (gray) and synaptic responses (black) evoked by glutamate uncaging photostimulation.
(D) Representative synaptic responses, for neurons of both genotypes. Dendritic responses have been blanked. Scale bar: 100 msec, 50 pA.

