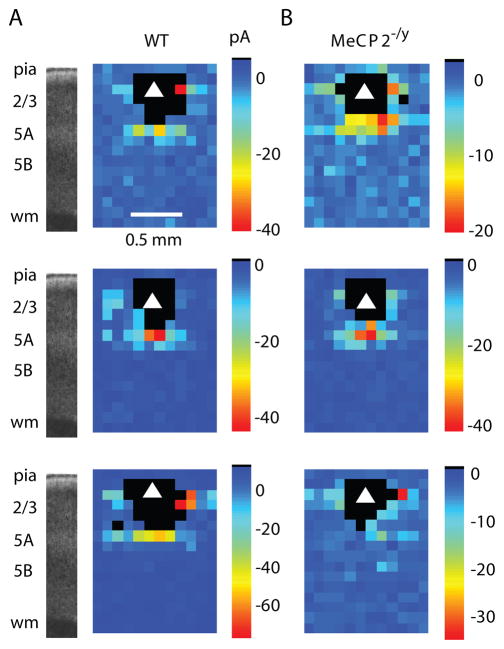
Figure 5. Excitatory input maps show decreased input to L2/3 pyramidal neurons in MeCP2−/y mice.
(A) Representative examples of LSPS maps for L2/3 pyramidal neurons from WT mice Black pixels: dendritic sites.
(B) Representative examples of MeCP2−/y maps. Top maps in A and B correspond to traces shown in Fig. 3D.

