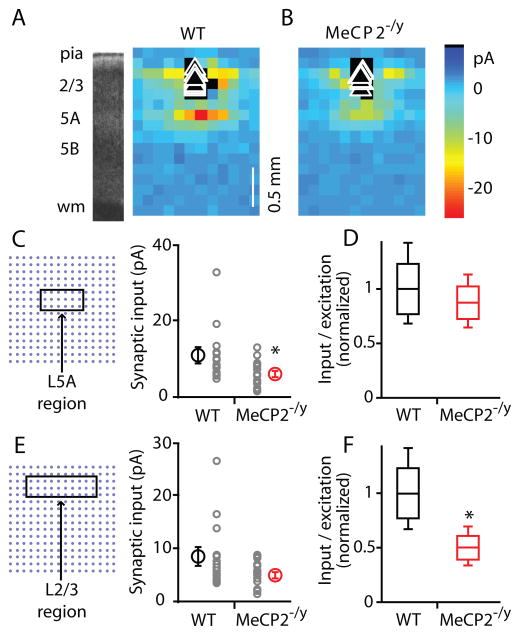
Figure 6. LSPS group data.
(A) Average maps recorded for L2/3 neurons in slices prepared from WT mice.
(B) Average maps for MeCP2−/y mice.
(C) Ascending synaptic input averaged across L3/5A ROI, not normalized for presynaptic photoexcitability (right). Schematic (left) shows the portion of the grid included in the ROI. Smaller circles: individual cells’ data points. Larger circles: mean values with s.e.m. bars. Asterisk indicates significant difference (p < 0.05, Wilcoxon rank sum test).
(D) Ascending synaptic input from L3/5A, normalized for presynaptic photoexcitability. Values shown represent mean synaptic input for the ROI indicated in C, divided by the mean number of action potentials per L3/5A excitation profile, and normalized to the mean WT value. Whisker plots: line within box represents the mean, and the upper and lower edges of the box represent ±1 s.d.; error bars show 95% c.i. (s.d. and c.i. were estimated by bootstrap methods; see Methods).
(E) Horizontal synaptic input averaged across L2/3 ROI, not normalized for presynaptic photoexcitability. Schematic (left) shows the portion of the grid included in the ROI. Smaller circles: individual cells’ data points. Larger circles: mean values with s.e.m. bars.
(F) Horizontal synaptic input from L2/3 normalized for presynaptic photoexcitability. See legend for panel D for definitions. Asterisk indicates significant difference (p < 0.05) based on comparison of means and 95% c.i. (see Methods).

