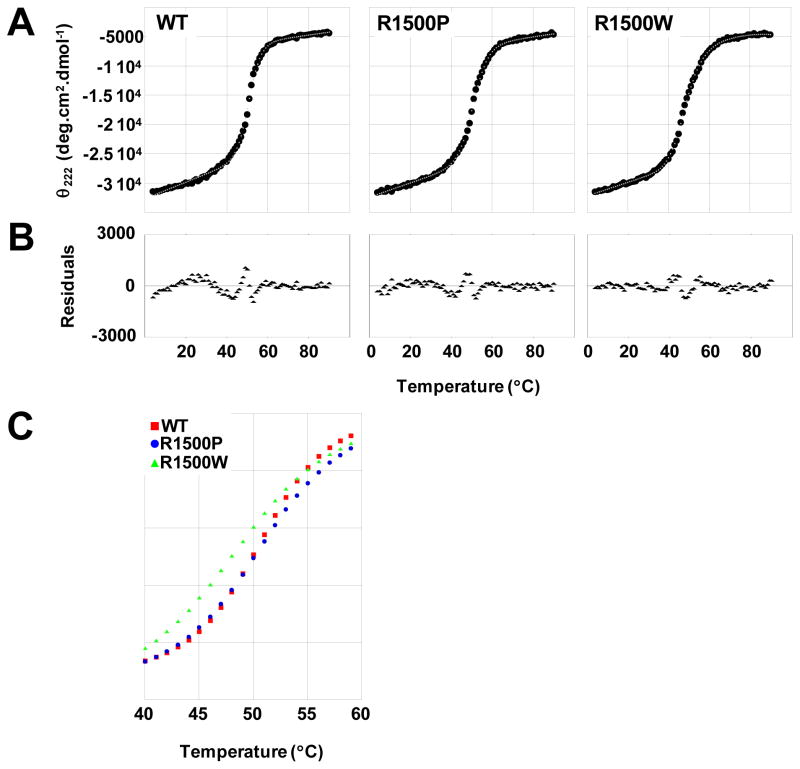
Fig 3.
Thermal denaturation of LMM reveals variation in R1500P and R1500W thermodynamic profiles. (A) The α-helical secondary structure of LMM was monitored by θ222 during thermally denaturation. Measured θ222 data (black) were fit to a theoretical model (gray) to derive thermodynamic parameters. (B) Residuals for the fit of the theoretical model to the measured data are calculated as the difference between the two at each point. Residuals are all around zero, indicating that our model fits well and shows no systematic deviation. (C) Fit θ222 data are plotted over the central segment of denaturation (40 °C to 60 °C) to directly illustrate differences in thermal stability. R1500W LMM (green) melts at a lower temperature and exhibits a wider transition than WT (red) and R1500P (blue) LMM, indicating a decreased cooperativity of melting for R1500W.

