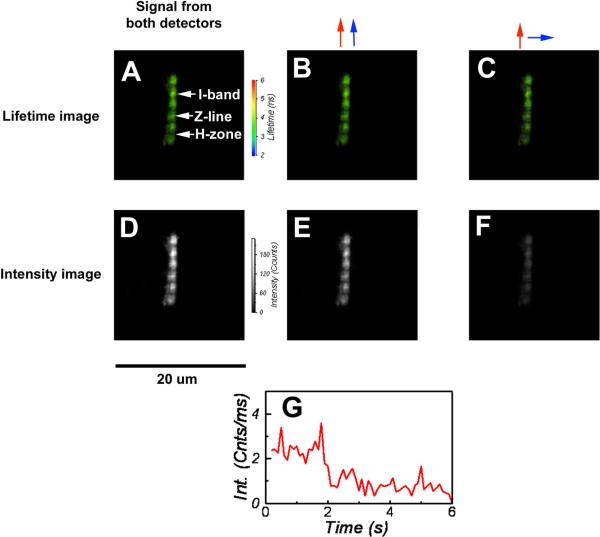
Fig. 1.
Lifetime (A, B, C) and polarization (D, E, F) images of rigor Tg-WT myofibril from the mouse heart (right ventricle). The color bar at right of A represents the intensity scale, with red corresponding to 6 nsec and blue to 2 nsec. The black and white bar at right of D, is the intensity scale with white corresponding to 255 and black to zero. Red and blue arrows indicate direction of polarization of excitation and fluorescent light, respectively. G: Sudden drop in total intensity to the level of the background in rigor muscle – behavior characteristic of single molecule bleaching. The intensity suddenly dropped at ~2sec. The rate of arrival of fluorescent photons before bleaching was 2.4 photons/ms (see text). Data acquired with the PicoQuant Micro Time 200 confocal lifetime microscope. Excitation with a 470 nm pulse of light, emission through LP500 filter. Myofibrils labeled with 0.1 μM Alexa488-phalloidin.

