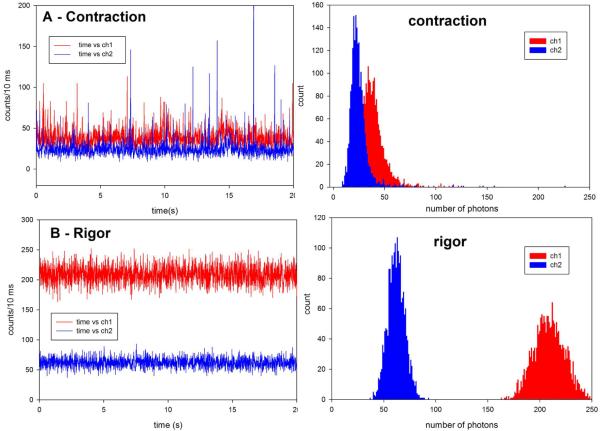
Fig. 2.
Comparison of the raw polarized fluorescence intensity signals of contracting (A) and rigor (B) myofibril from Tg-WT heart. The original data was collected every 10 μsec but 1000 points are binned together to give 10 msec time resolution, i.e. the vertical scale is the number of counts during 10 ms. Note that the scale in both panels is the same. Myofibrillar axis is horizontal on the microscope stage. Laser polarization is vertical on the microscope stage. Ch1 (red) and ch2 (blue) are the fluorescence intensities polarized perpendicular and parallel to the myofibrillar axis, respectively. Right panels: Histogram of the intensity of vertical polarized intensity component of contracting (top) and rigor (bottom) myofibril from the same experiment on Tg-WT heart.

