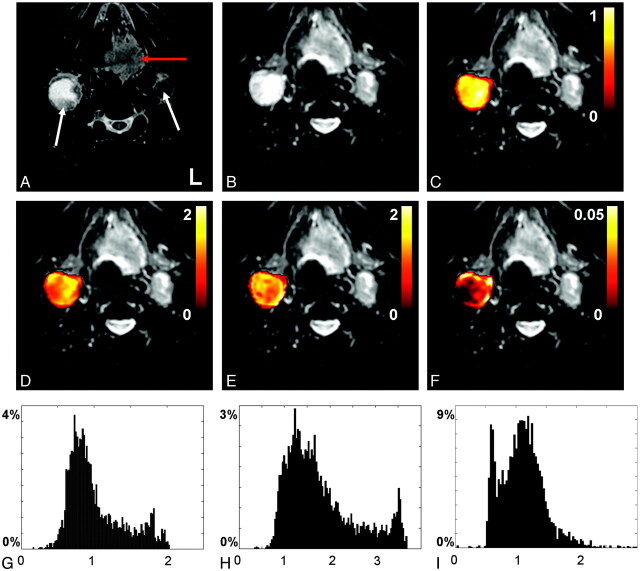
Fig 2.
Axial MR images from the oral cavity of a male patient diagnosed with base of tongue cancer (patient 12). A, T2 short tau inversion recovery image. B, Realigned mean b = 0 image. The red and white arrows in A indicate the primary tumor and metastatic nodes, respectively. C–F display voxel-by-voxel calculation outcomes for the right node presented as mask overlays on the realigned mean b = 0 image. G–I display the corresponding histogram distribution plots of the measures from C–E. C and G, Apparent diffusion coefficient obtained from monoexponential fitting (10−3 mm2/s). D and H, Apparent diffusion coefficient (10−3 mm2/s), (E and I) apparent kurtosis coefficient (dimensionless), and (F) reduced χ2 error estimate, all obtained from the diffusional kurtosis analysis.

