
Figure 1. The phenotype of hESCs and modulation of FGF-signaling in their differentiated progeny.
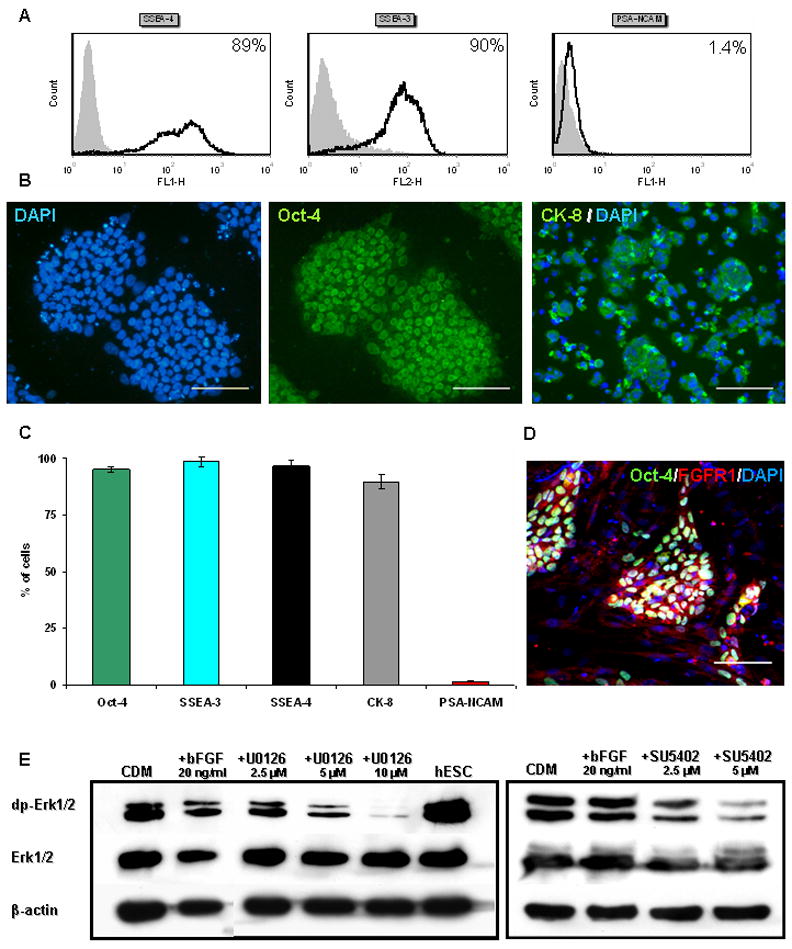
Representative FACS analysis (A) and immunostaining (B) showing that the majority of HES-1 cells express SSEA-4, SSEA-3, Oct-4 and CK-8, while minute percentage express PSA-NCAM. (C) A histogram summarizing the results from four independent experiments. (D) Immuno-fluorescence staining of undifferentiated hESCs co-expressing Oct-4 and FGFR1. (E) Western Blot analysis of the level of dp-Erk1/2 in hESCs, and in hESC-clusters after 7 days’ differentiation in CDM. After 3 hours’ treatment with the inhibitors U0126 and SU5402, a dose-dependent decrease in the levels of dp-Erk1/2 is evident.
Scale bars 100μM